 1
1peptide
spectra
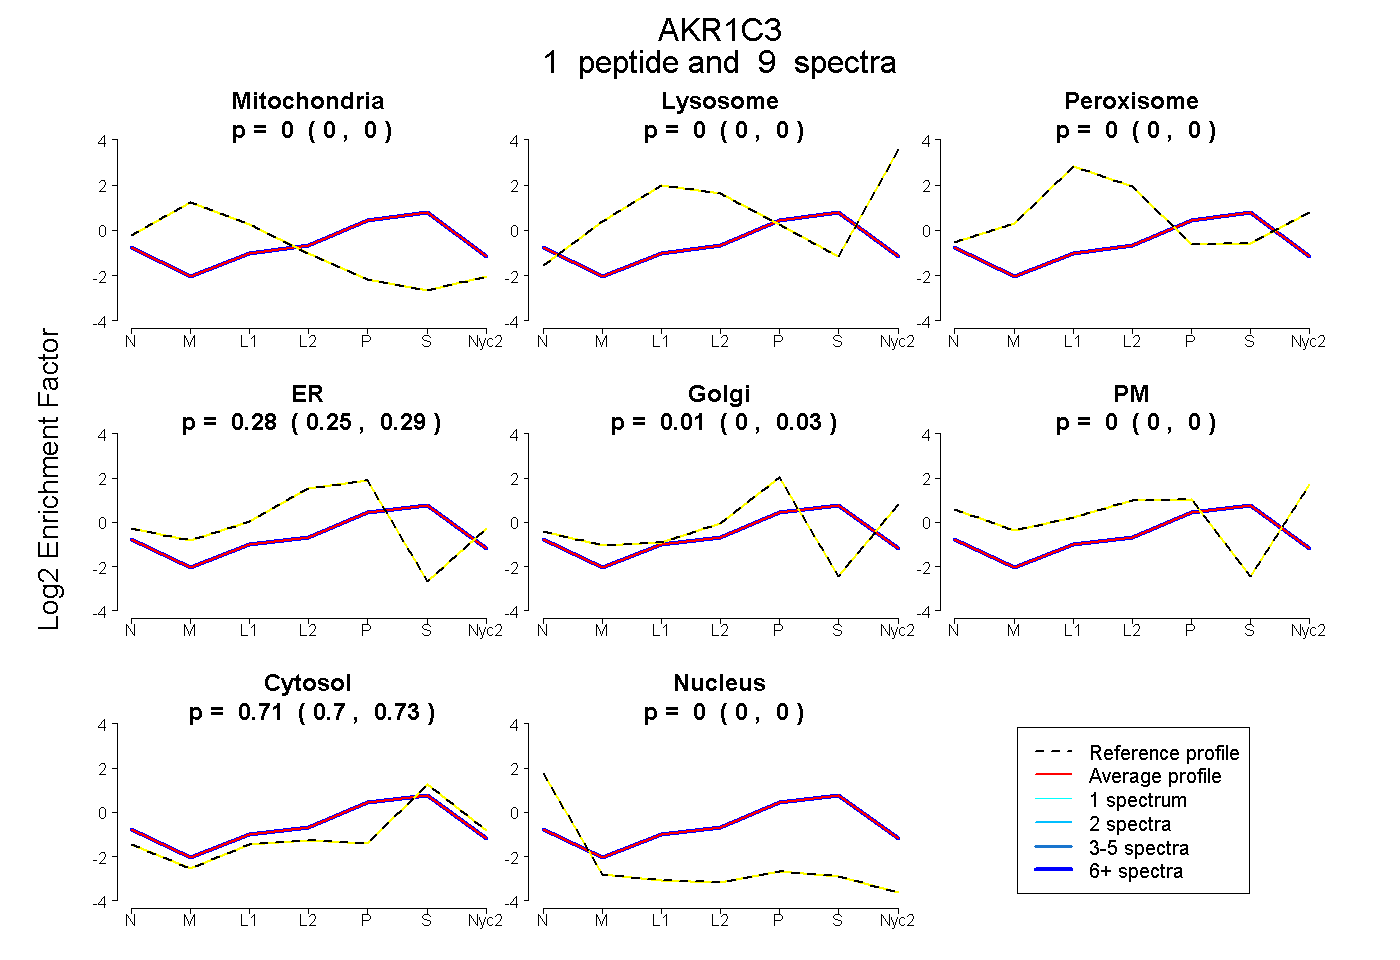
0.000 | 0.000
0.000 | 0.000
0.000 | 0.000
0.251 | 0.292
0.000 | 0.033
0.000 | 0.000
0.697 | 0.727
0.000 | 0.000
1peptide
spectra
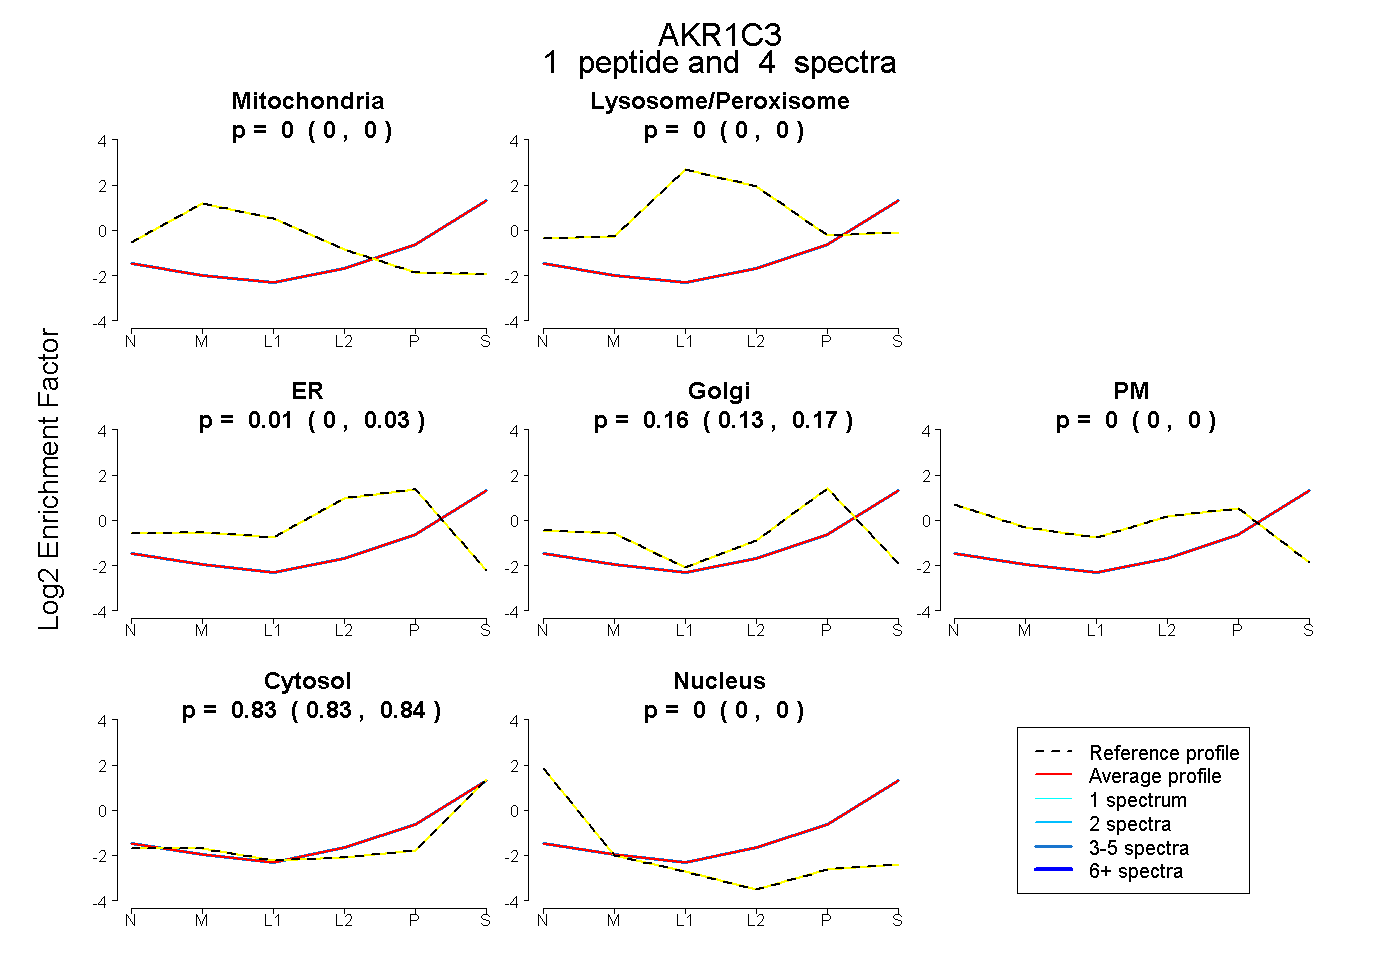
0.000 | 0.000
0.000 | 0.000
0.000 | 0.029
0.133 | 0.170
0.000 | 0.000
0.828 | 0.836
0.000 | 0.000
1peptide
spectra
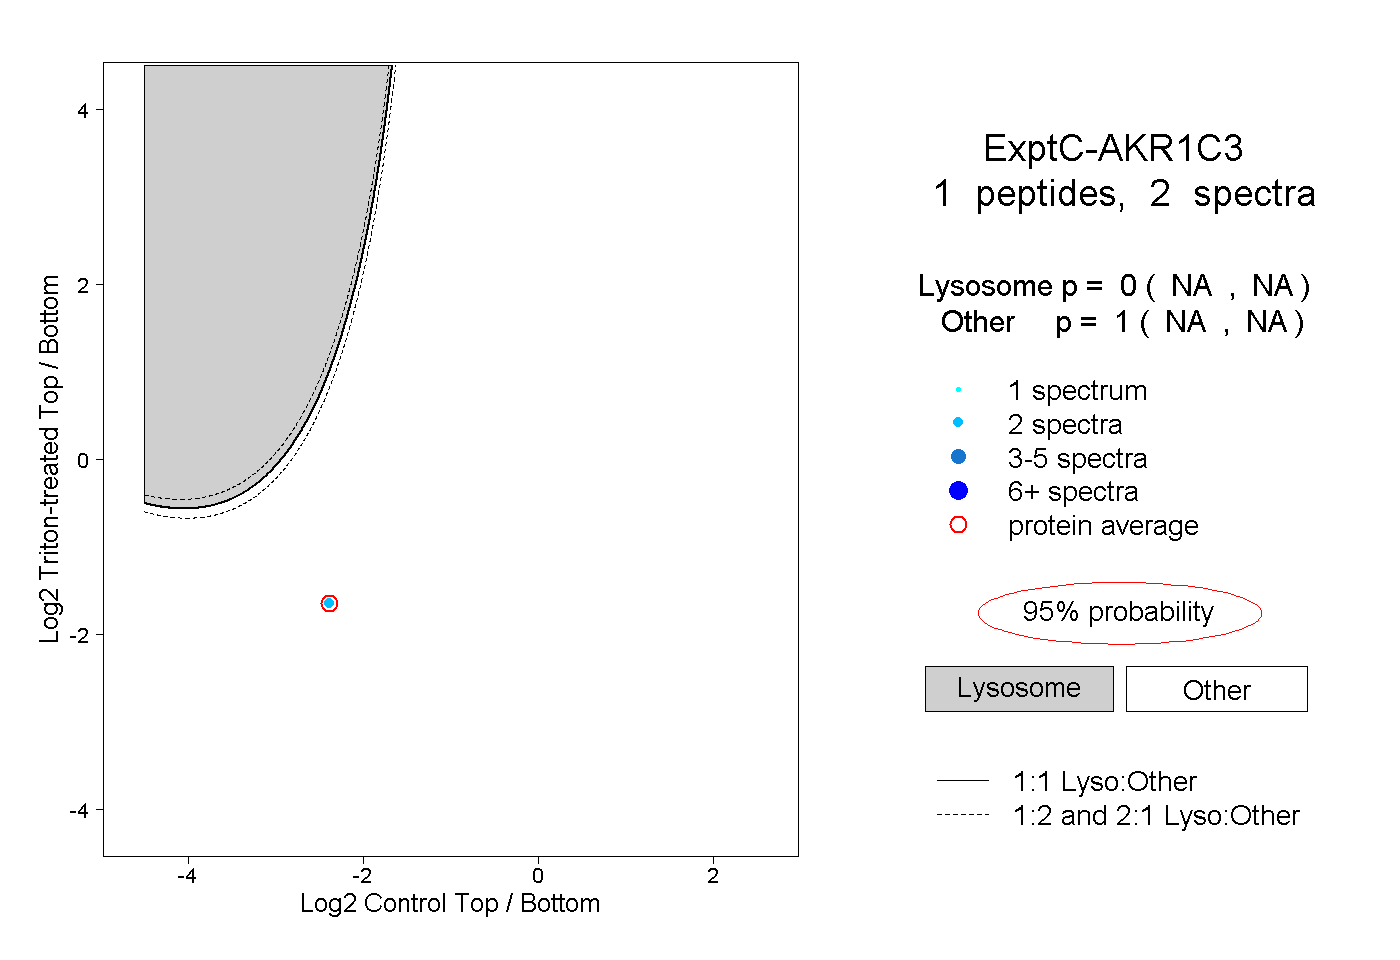
NA | NA
NA | NA
1peptide
spectra
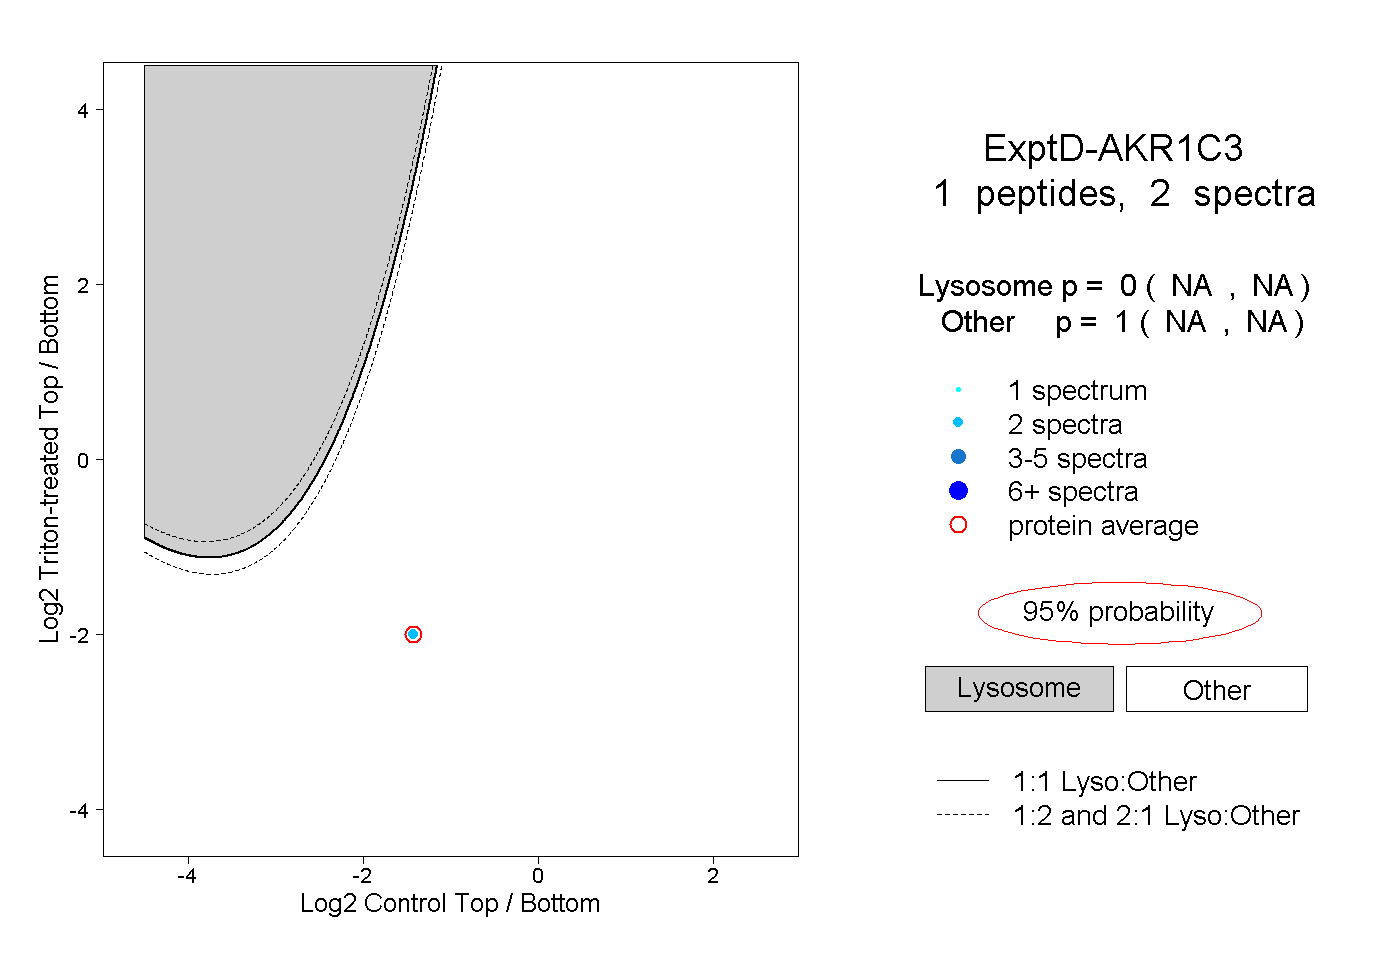
NA | NA
NA | NA