 6
6peptides
spectra
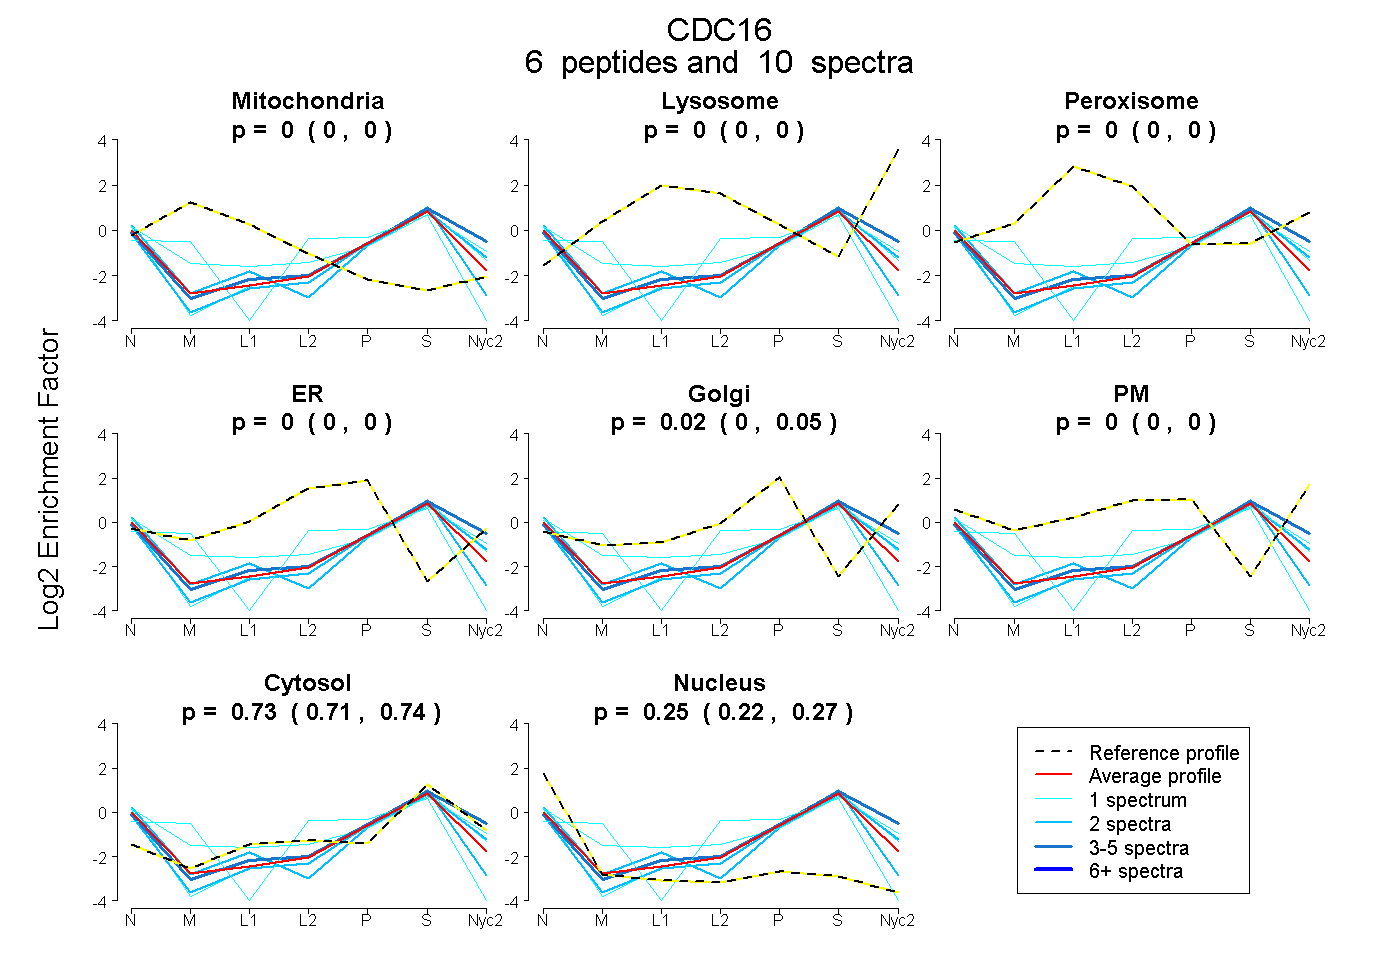
0.000 | 0.000
0.000 | 0.000
0.000 | 0.000
0.000 | 0.000
0.000 | 0.047
0.000 | 0.000
0.714 | 0.737
0.222 | 0.273
| Plot | Mito | Lyso | Perox | ER | Golgi | PM | Cytosol | Nucleus | |||||
| Expt A |
6 peptides |
10 spectra |
|
0.000 0.000 | 0.000 |
0.000 0.000 | 0.000 |
0.000 0.000 | 0.000 |
0.000 0.000 | 0.000 |
0.024 0.000 | 0.047 |
0.000 0.000 | 0.000 |
0.726 0.714 | 0.737 |
0.250 0.222 | 0.273 |
| 1 spectrum, YAEALDYHR | 0.019 | 0.000 | 0.000 | 0.127 | 0.000 | 0.000 | 0.527 | 0.327 | ||
| 3 spectra, WFLDALEK | 0.000 | 0.000 | 0.000 | 0.000 | 0.092 | 0.000 | 0.776 | 0.132 | ||
| 1 spectrum, DFEVEK | 0.000 | 0.000 | 0.000 | 0.000 | 0.000 | 0.000 | 0.769 | 0.231 | ||
| 2 spectra, LCAEEQELLR | 0.000 | 0.000 | 0.000 | 0.000 | 0.000 | 0.000 | 0.678 | 0.322 | ||
| 2 spectra, ELLDSLPLSK | 0.000 | 0.000 | 0.000 | 0.000 | 0.027 | 0.000 | 0.720 | 0.253 | ||
| 1 spectrum, TLATYSYK | 0.010 | 0.000 | 0.000 | 0.000 | 0.000 | 0.173 | 0.673 | 0.144 |
| Plot | Lyso | Other | |||||||||||
| Expt C |
1 peptide |
6 spectra |
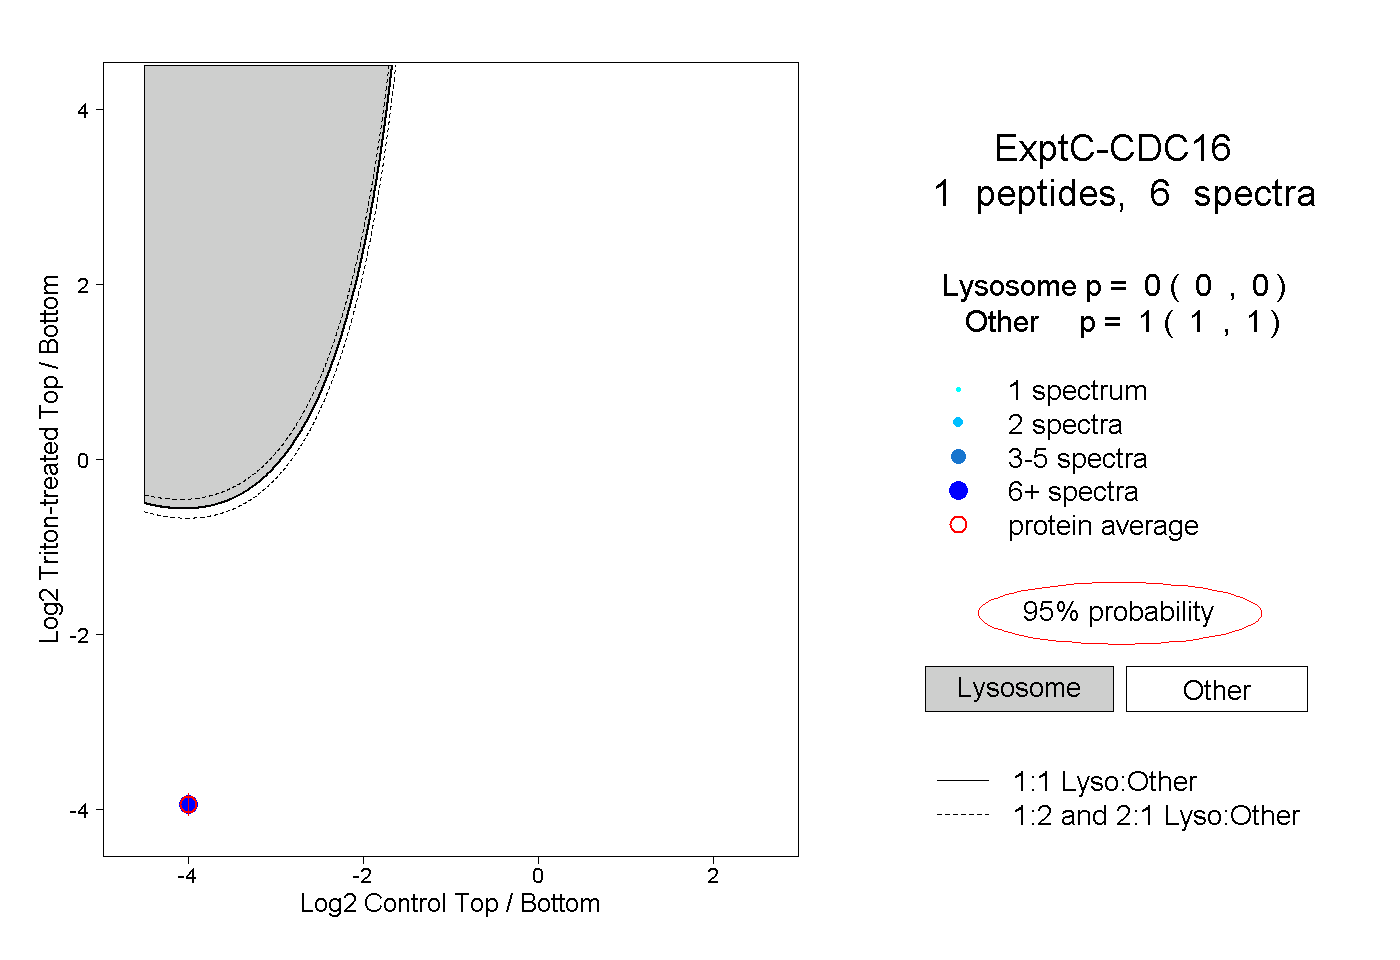 |
0.000 0.000 | 0.000 |
1.000 1.000 | 1.000 |