 3
3peptides
spectra
0.000 | 0.000
0.000 | 0.000
0.000 | 0.159
0.000 | 0.067
0.328 | 0.582
0.000 | 0.223
0.286 | 0.406
0.000 | 0.000
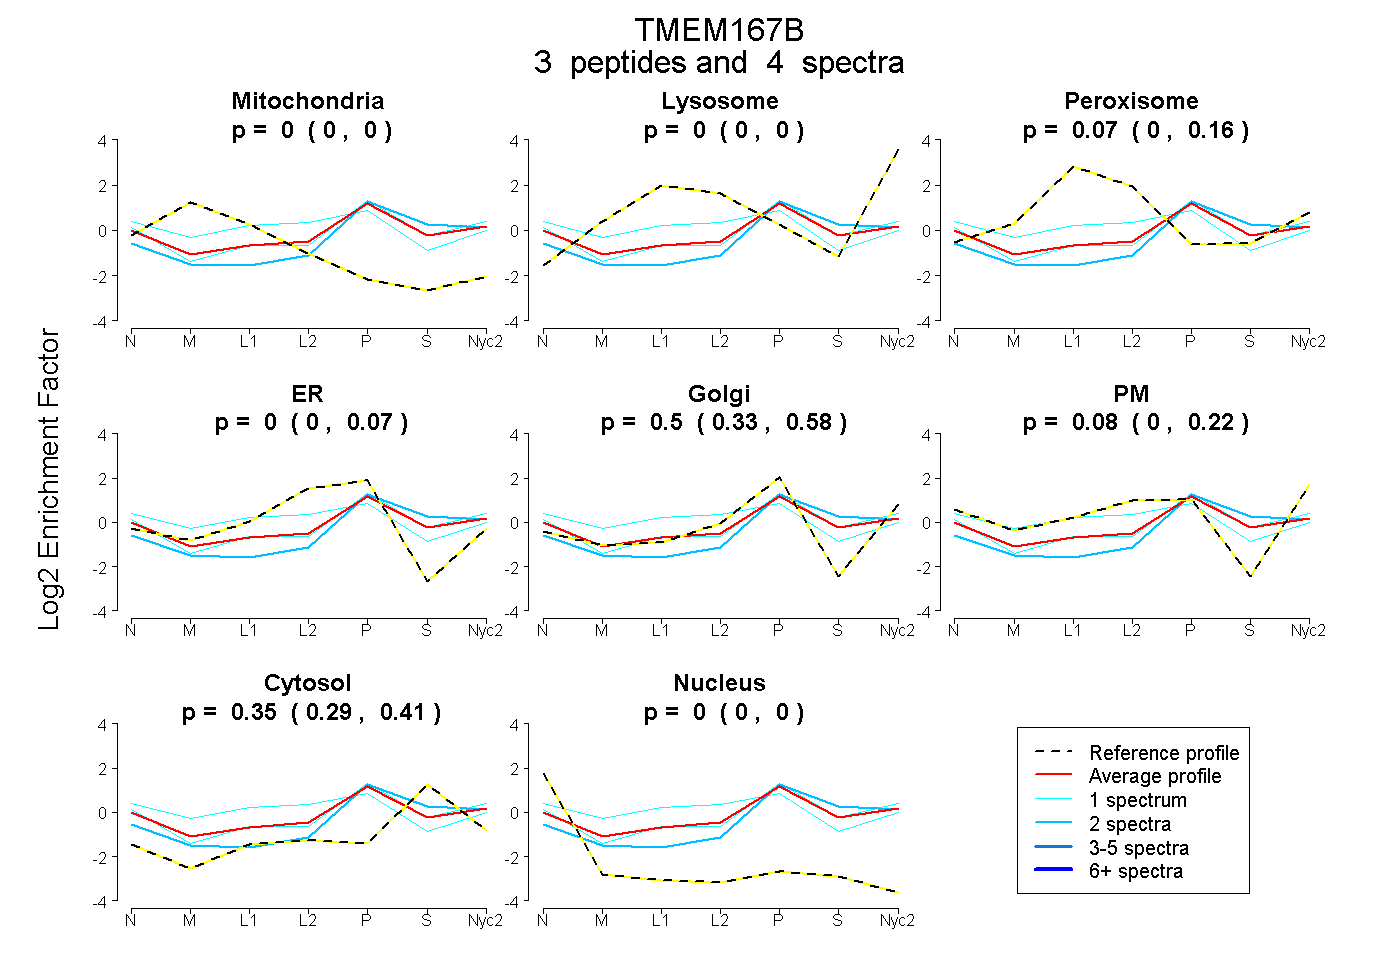
| Plot | Mito | Lyso | Perox | ER | Golgi | PM | Cytosol | Nucleus | |||||
| Expt A |
3 peptides |
4 spectra |
|
0.000 0.000 | 0.000 |
0.000 0.000 | 0.000 |
0.068 0.000 | 0.159 |
0.000 0.000 | 0.067 |
0.498 0.328 | 0.582 |
0.083 0.000 | 0.223 |
0.351 0.286 | 0.406 |
0.000 0.000 | 0.000 |
| 1 spectrum, AAVIGTR | 0.000 | 0.000 | 0.000 | 0.000 | 0.455 | 0.179 | 0.366 | 0.000 | ||
| 1 spectrum, GVWGVFYK | 0.028 | 0.000 | 0.253 | 0.142 | 0.212 | 0.183 | 0.135 | 0.047 | ||
| 2 spectra, TWLLSEK | 0.000 | 0.000 | 0.000 | 0.000 | 0.512 | 0.000 | 0.488 | 0.000 |