 1
1peptide
spectra
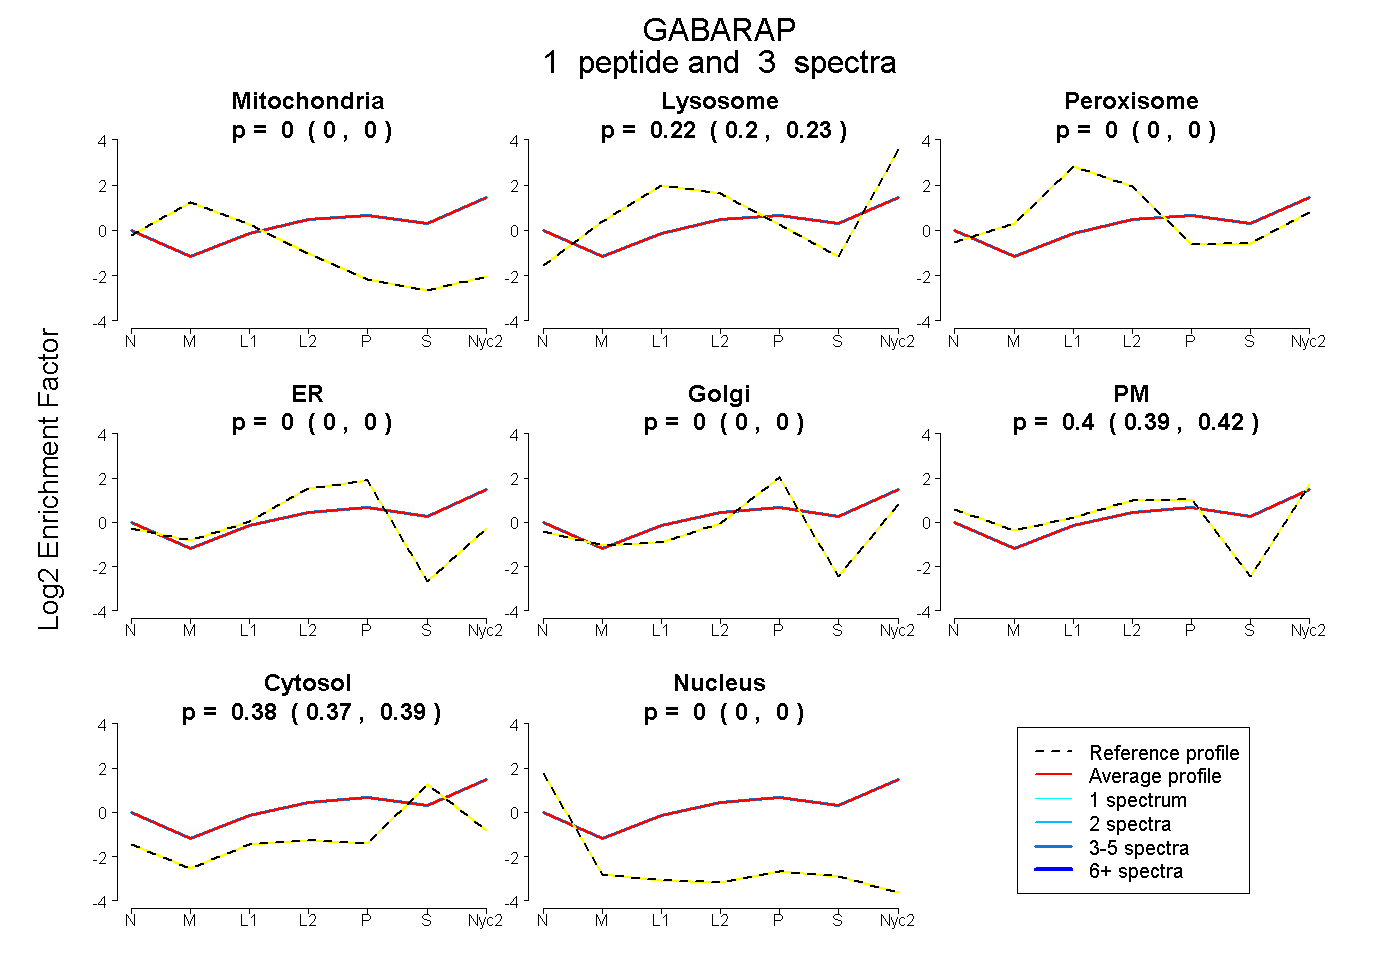
0.000 | 0.000
0.202 | 0.227
0.000 | 0.000
0.000 | 0.000
0.000 | 0.000
0.387 | 0.416
0.375 | 0.388
0.000 | 0.000
1peptide
spectra
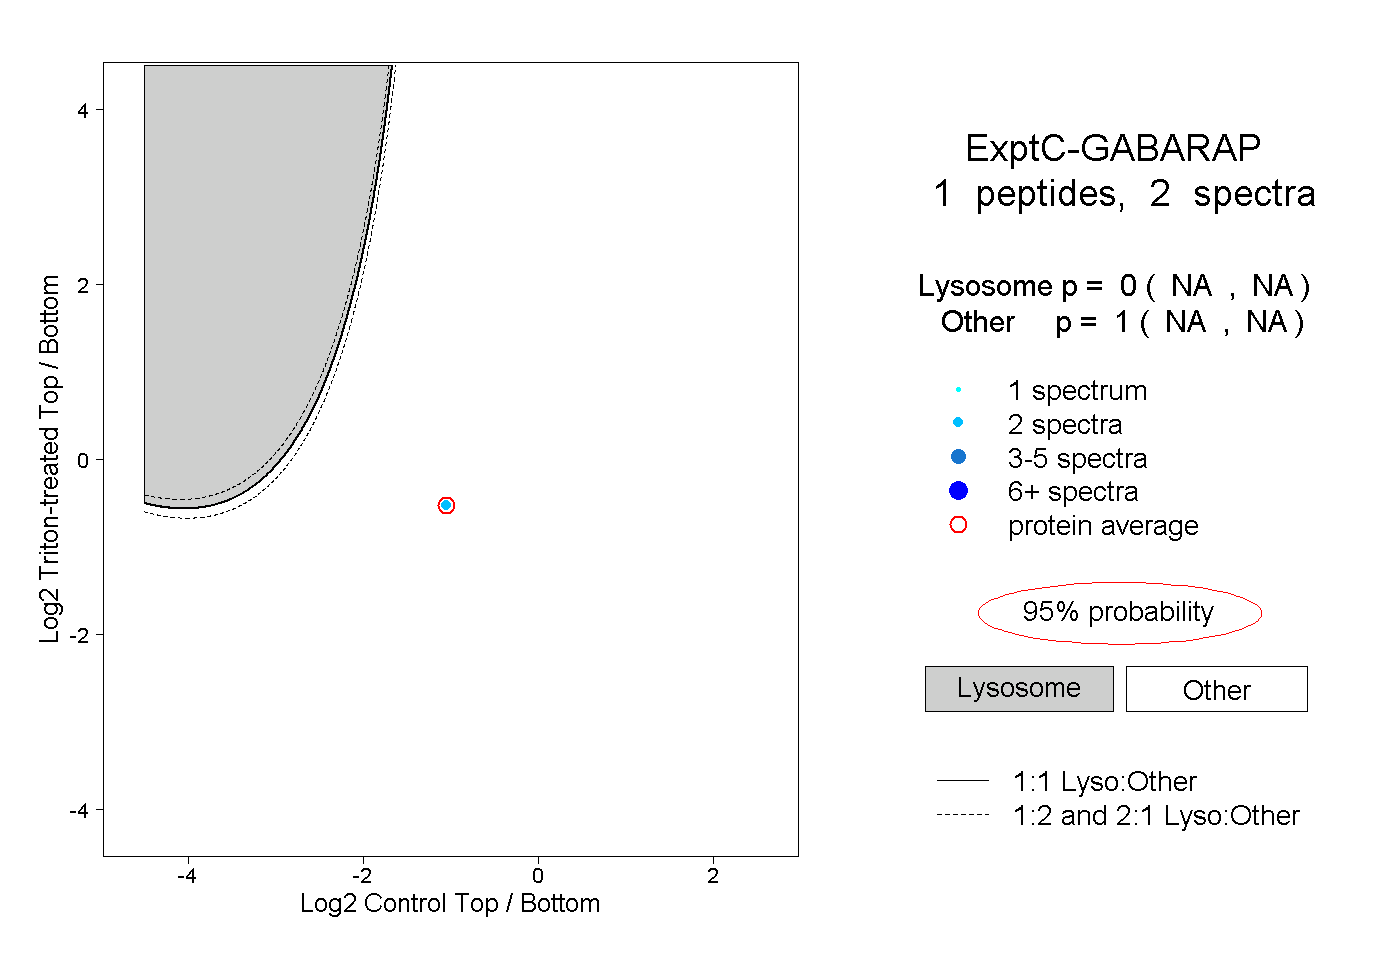
NA | NA
NA | NA
1peptide
spectra
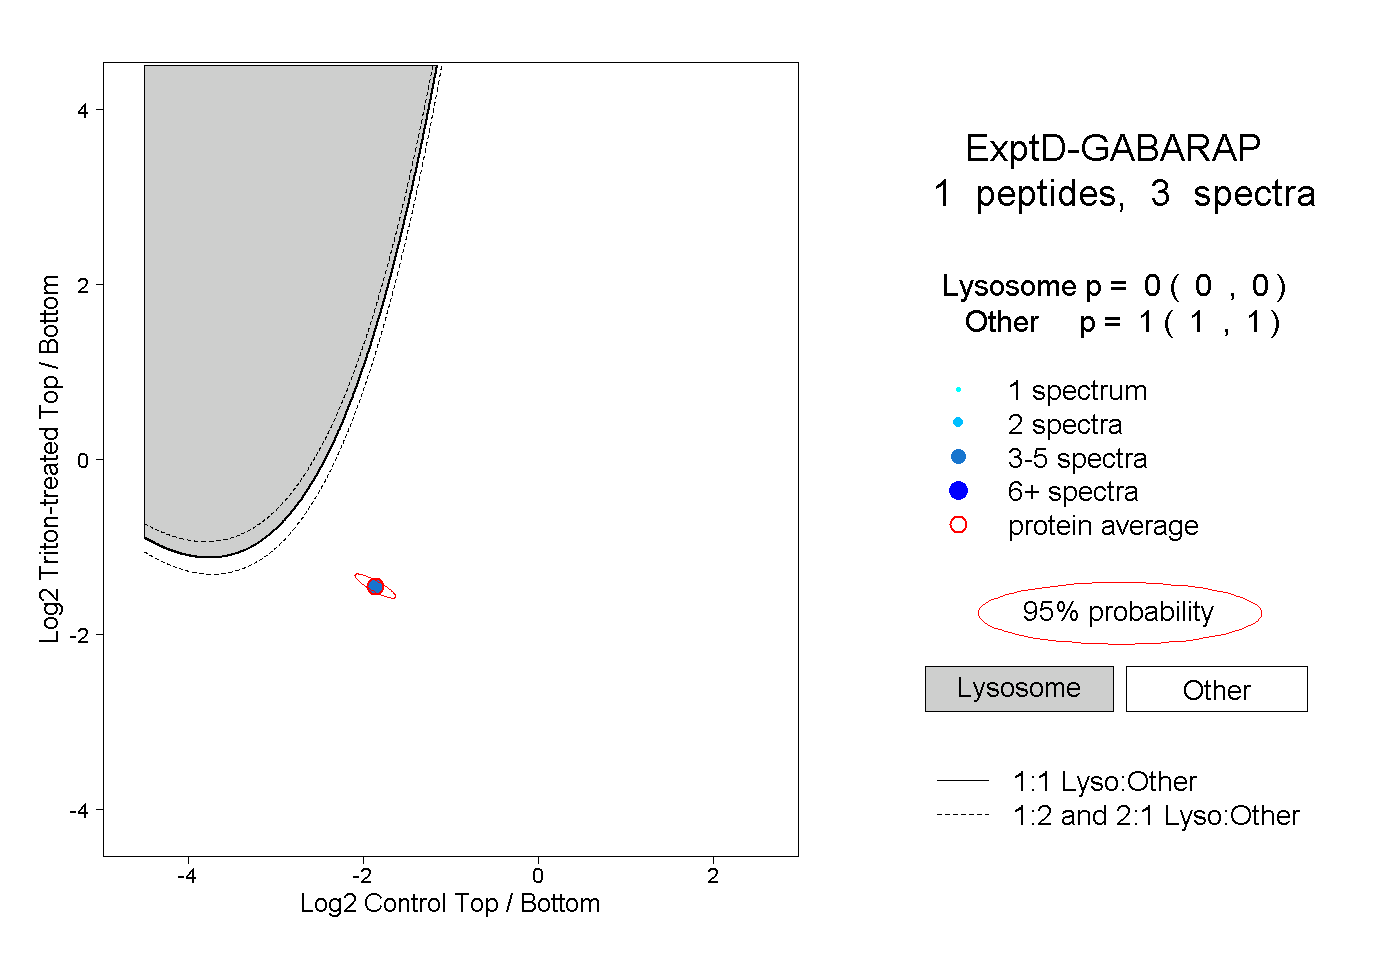
0.000 | 0.000
1.000 | 1.000