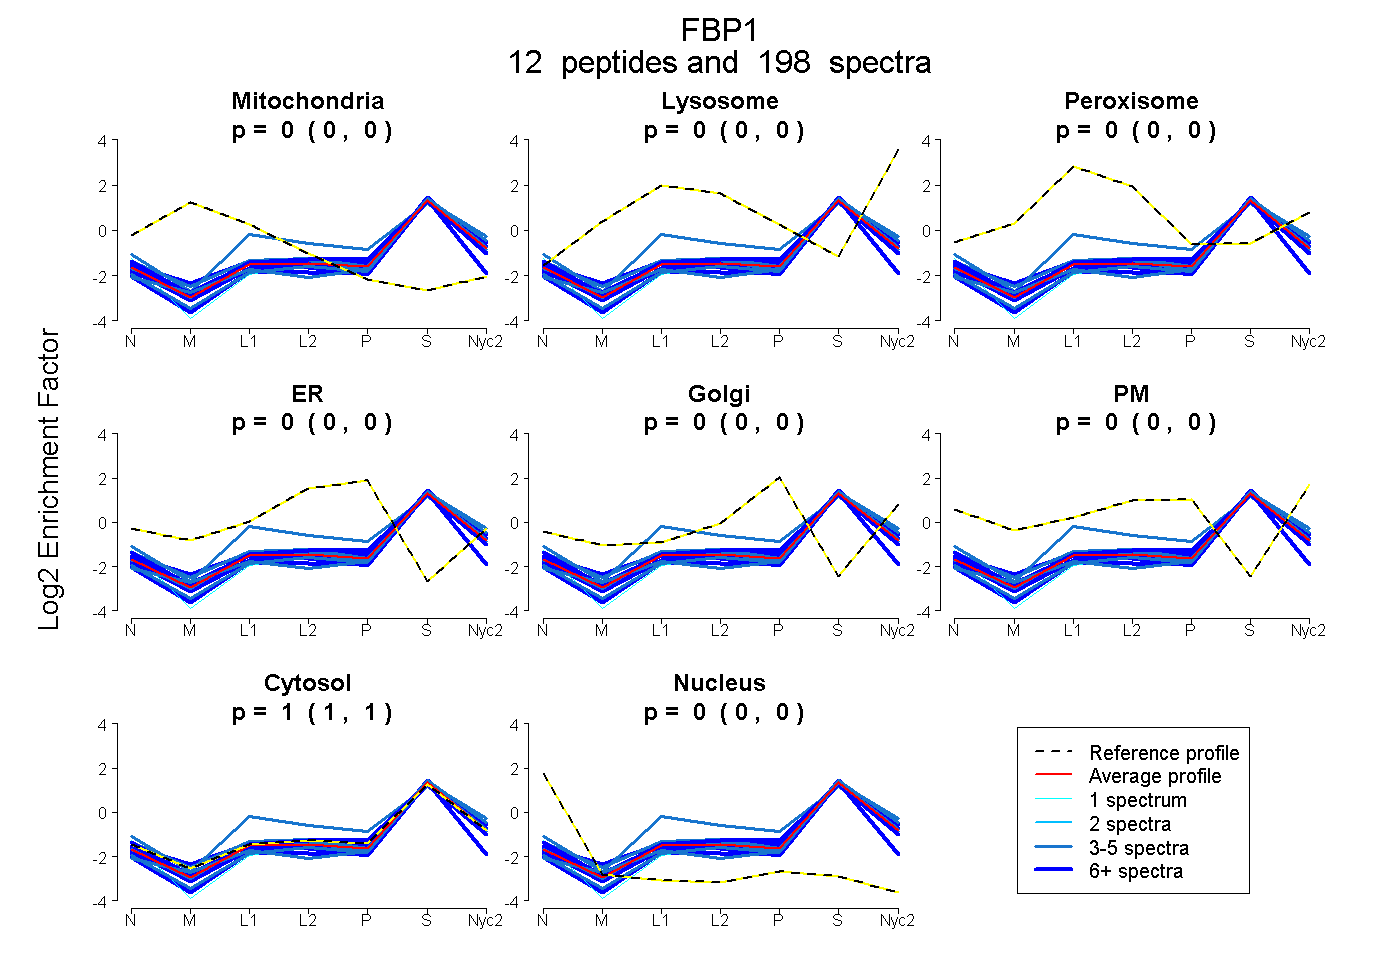
 12
12peptides
spectra
0.000 | 0.000
0.000 | 0.000
0.000 | 0.000
0.000 | 0.000
0.000 | 0.000
0.000 | 0.000
1.000 | 1.000
0.000 | 0.000
| Plot | Mito | Lyso | Perox | ER | Golgi | PM | Cytosol | Nucleus | |||||
| Expt A |
12 peptides |
198 spectra |
|
0.000 0.000 | 0.000 |
0.000 0.000 | 0.000 |
0.000 0.000 | 0.000 |
0.000 0.000 | 0.000 |
0.000 0.000 | 0.000 |
0.000 0.000 | 0.000 |
1.000 1.000 | 1.000 |
0.000 0.000 | 0.000 |
| 1 spectrum, APVIMGSTEDVQEFLEIYNK | 0.000 | 0.000 | 0.000 | 0.000 | 0.000 | 0.000 | 0.959 | 0.041 | ||
| 76 spectra, SRPSLPLPQSR | 0.000 | 0.000 | 0.000 | 0.000 | 0.000 | 0.000 | 0.987 | 0.013 | ||
| 4 spectra, ESPVHSICDELF | 0.000 | 0.000 | 0.195 | 0.000 | 0.000 | 0.000 | 0.805 | 0.000 | ||
| 30 spectra, DALQPGR | 0.000 | 0.000 | 0.000 | 0.000 | 0.000 | 0.000 | 1.000 | 0.000 | ||
| 5 spectra, GNIYSINEGYAK | 0.000 | 0.007 | 0.000 | 0.000 | 0.000 | 0.000 | 0.993 | 0.000 | ||
| 6 spectra, FVLEEGR | 0.000 | 0.000 | 0.000 | 0.000 | 0.000 | 0.000 | 1.000 | 0.000 | ||
| 3 spectra, VDHAPFETDISTLTR | 0.000 | 0.000 | 0.000 | 0.000 | 0.000 | 0.000 | 1.000 | 0.000 | ||
| 11 spectra, LLYECNPIAYVMEK | 0.000 | 0.000 | 0.000 | 0.000 | 0.000 | 0.000 | 0.935 | 0.065 | ||
| 3 spectra, LDILSNDLVINMLK | 0.010 | 0.000 | 0.009 | 0.000 | 0.000 | 0.000 | 0.981 | 0.000 | ||
| 37 spectra, AISSAVR | 0.000 | 0.000 | 0.000 | 0.000 | 0.000 | 0.000 | 0.991 | 0.009 | ||
| 17 spectra, DFDPAINEYIQR | 0.013 | 0.010 | 0.000 | 0.000 | 0.000 | 0.000 | 0.977 | 0.000 | ||
| 5 spectra, TSANEPSEK | 0.000 | 0.000 | 0.000 | 0.000 | 0.000 | 0.000 | 1.000 | 0.000 |
| Plot | Mito | Lyso or Perox | ER | Golgi | PM | Cytosol | Nucleus | ||||||
| Expt B |
11 peptides |
101 spectra |
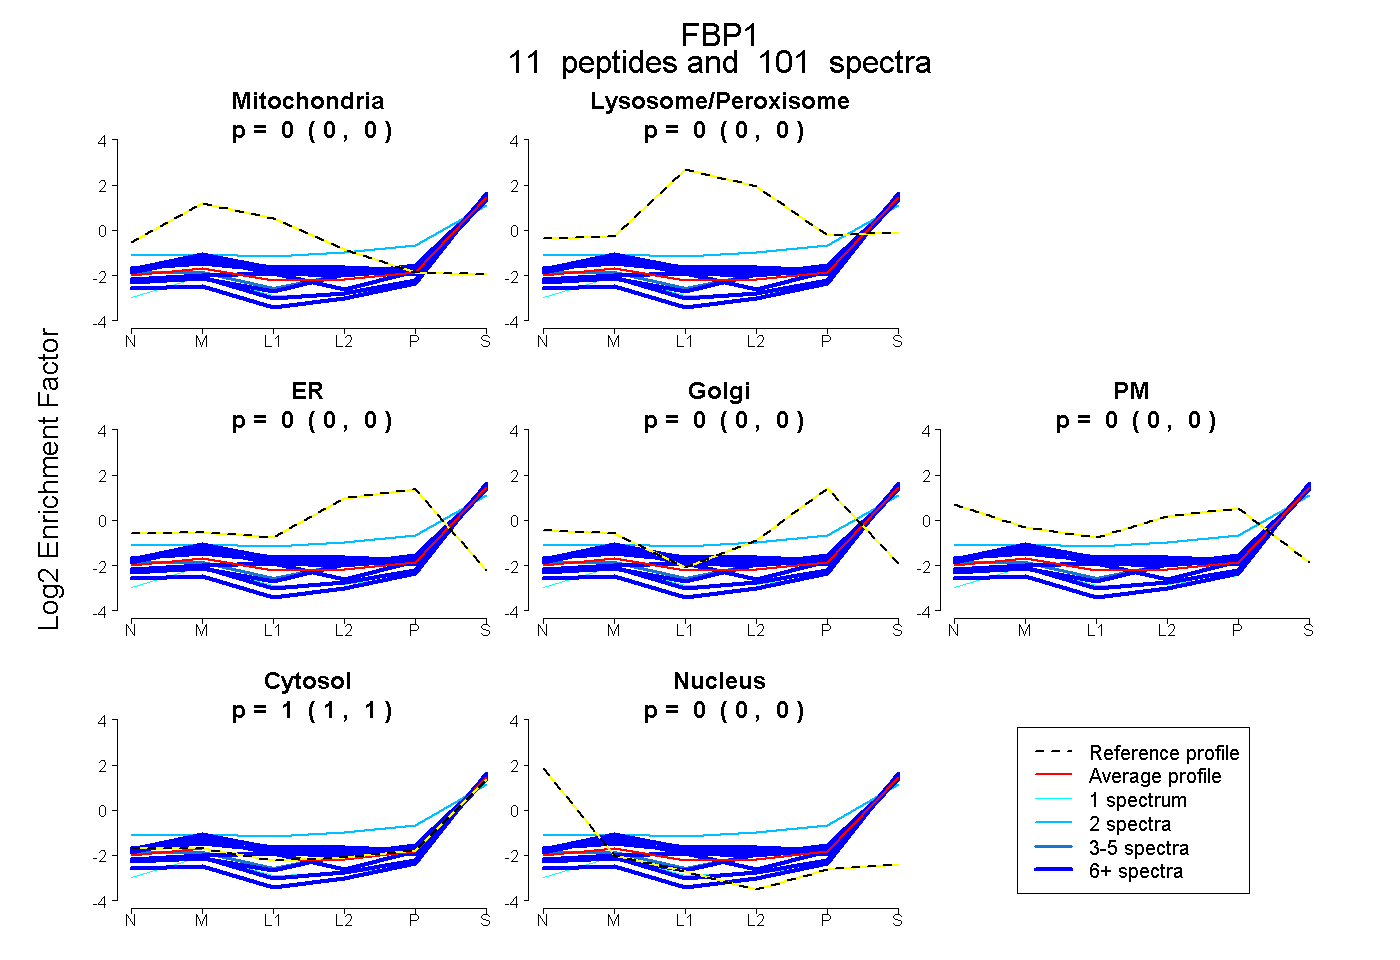 |
0.000 0.000 | 0.000 |
0.000 0.000 | 0.000 |
0.000 0.000 | 0.000 |
0.000 0.000 | 0.000 |
0.000 0.000 | 0.000 |
1.000 1.000 | 1.000 |
0.000 0.000 | 0.000 |
|||
| Plot | Lyso | Other | |||||||||||
| Expt C |
14 peptides |
217 spectra |
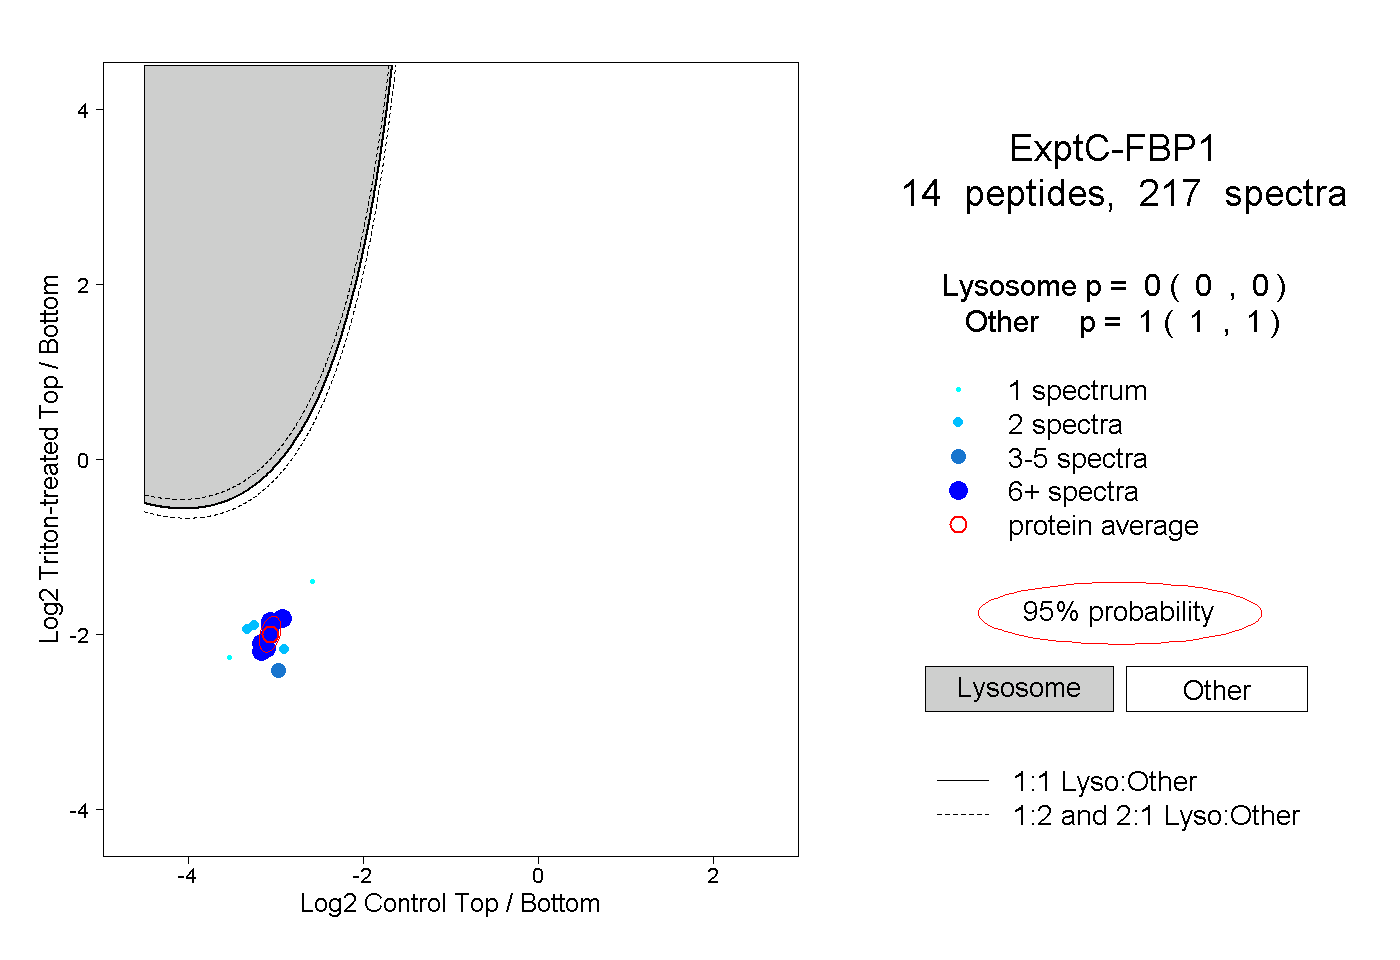 |
0.000 0.000 | 0.000 |
1.000 1.000 | 1.000 |
||||||||
| Plot | Lyso | Other | |||||||||||
| Expt D |
7 peptides |
15 spectra |
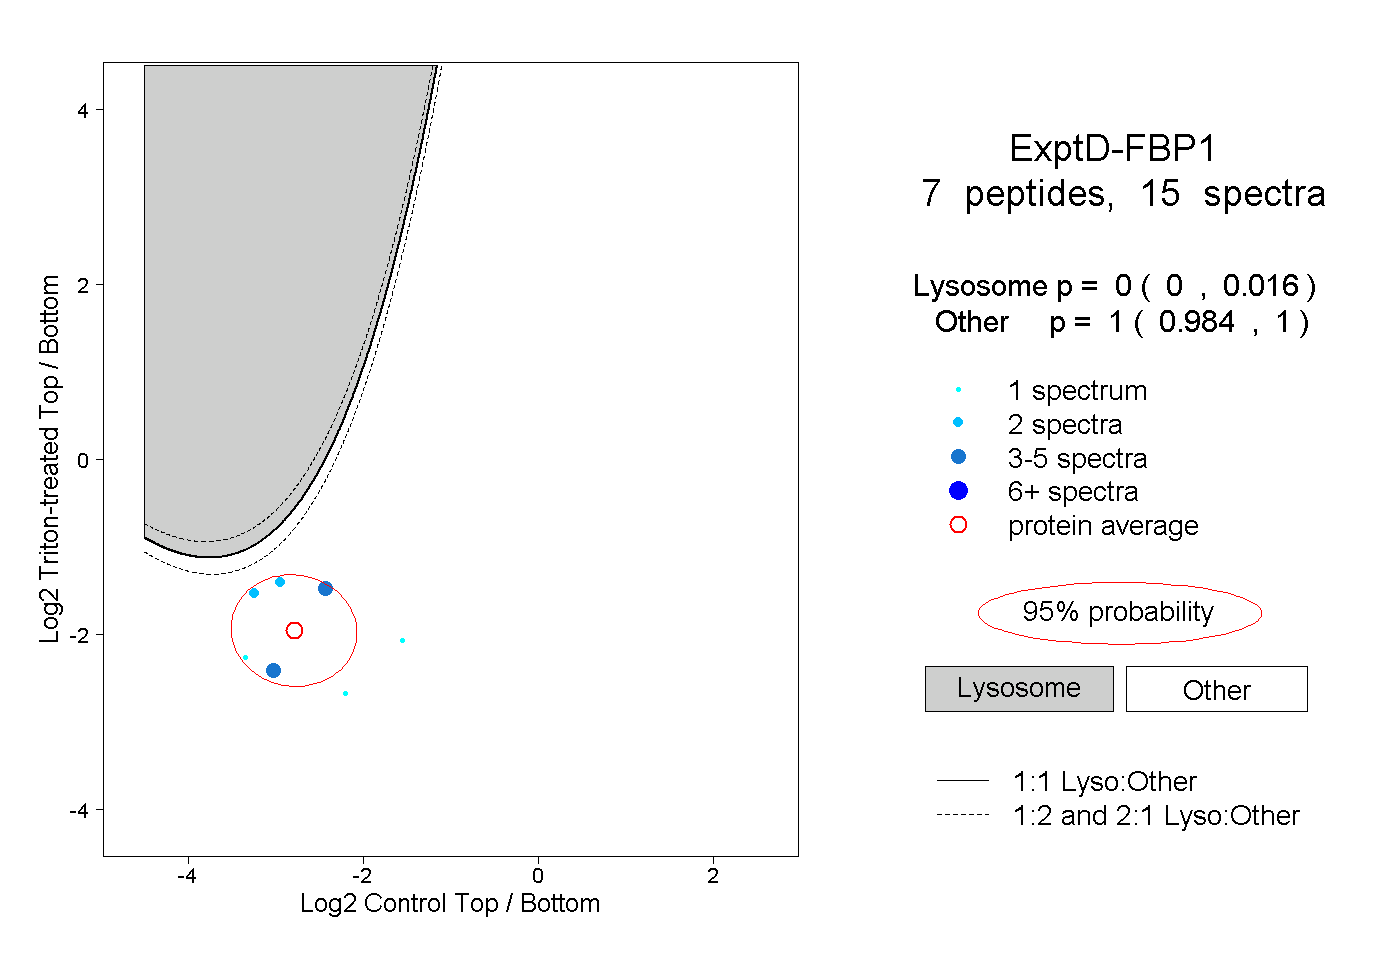 |
0.000 0.000 | 0.016 |
1.000 0.984 | 1.000 |