 5
5peptides
spectra
0.000 | 0.000
0.139 | 0.284
0.000 | 0.086
0.000 | 0.000
0.059 | 0.180
0.000 | 0.092
0.559 | 0.620
0.000 | 0.000
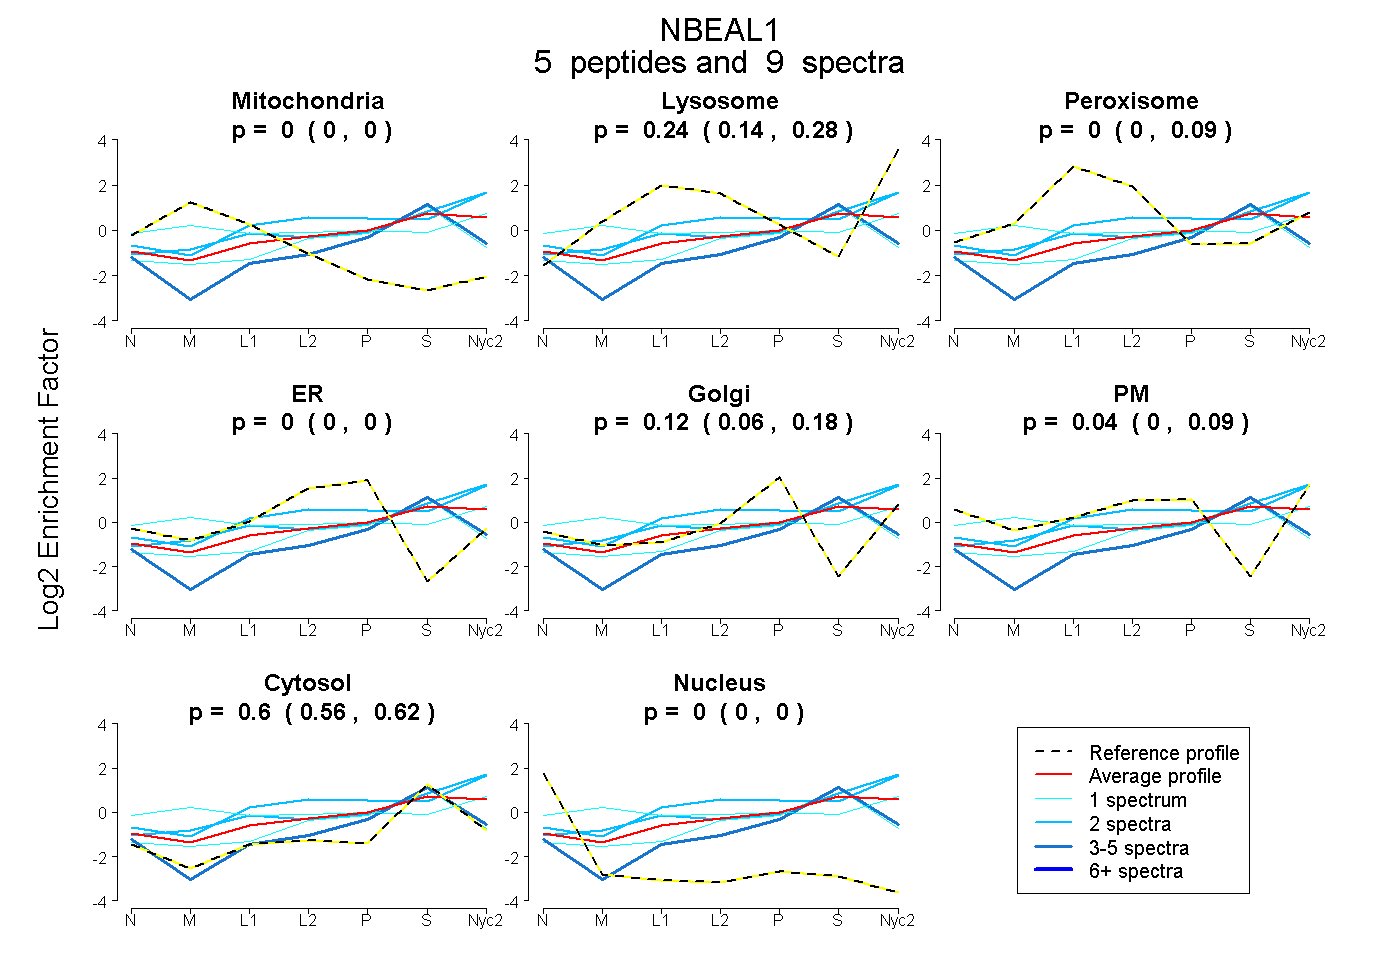
| Plot | Mito | Lyso | Perox | ER | Golgi | PM | Cytosol | Nucleus | |||||
| Expt A |
5 peptides |
9 spectra |
|
0.000 0.000 | 0.000 |
0.241 0.139 | 0.284 |
0.000 0.000 | 0.086 |
0.000 0.000 | 0.000 |
0.124 0.059 | 0.180 |
0.036 0.000 | 0.092 |
0.599 0.559 | 0.620 |
0.000 0.000 | 0.000 |
| 2 spectra, LIVVGVGKPAEMR | 0.000 | 0.458 | 0.000 | 0.000 | 0.015 | 0.000 | 0.527 | 0.000 | ||
| 1 spectrum, WPHSQIR | 0.123 | 0.171 | 0.057 | 0.000 | 0.000 | 0.317 | 0.331 | 0.000 | ||
| 2 spectra, DLLSIVYICHR | 0.000 | 0.425 | 0.000 | 0.000 | 0.036 | 0.142 | 0.397 | 0.000 | ||
| 3 spectra, SDEDTWIER | 0.000 | 0.000 | 0.000 | 0.000 | 0.130 | 0.000 | 0.870 | 0.000 | ||
| 1 spectrum, LVSHNIR | 0.000 | 0.029 | 0.001 | 0.205 | 0.000 | 0.000 | 0.765 | 0.000 |
| Plot | Lyso | Other | |||||||||||
| Expt C |
2 peptides |
2 spectra |
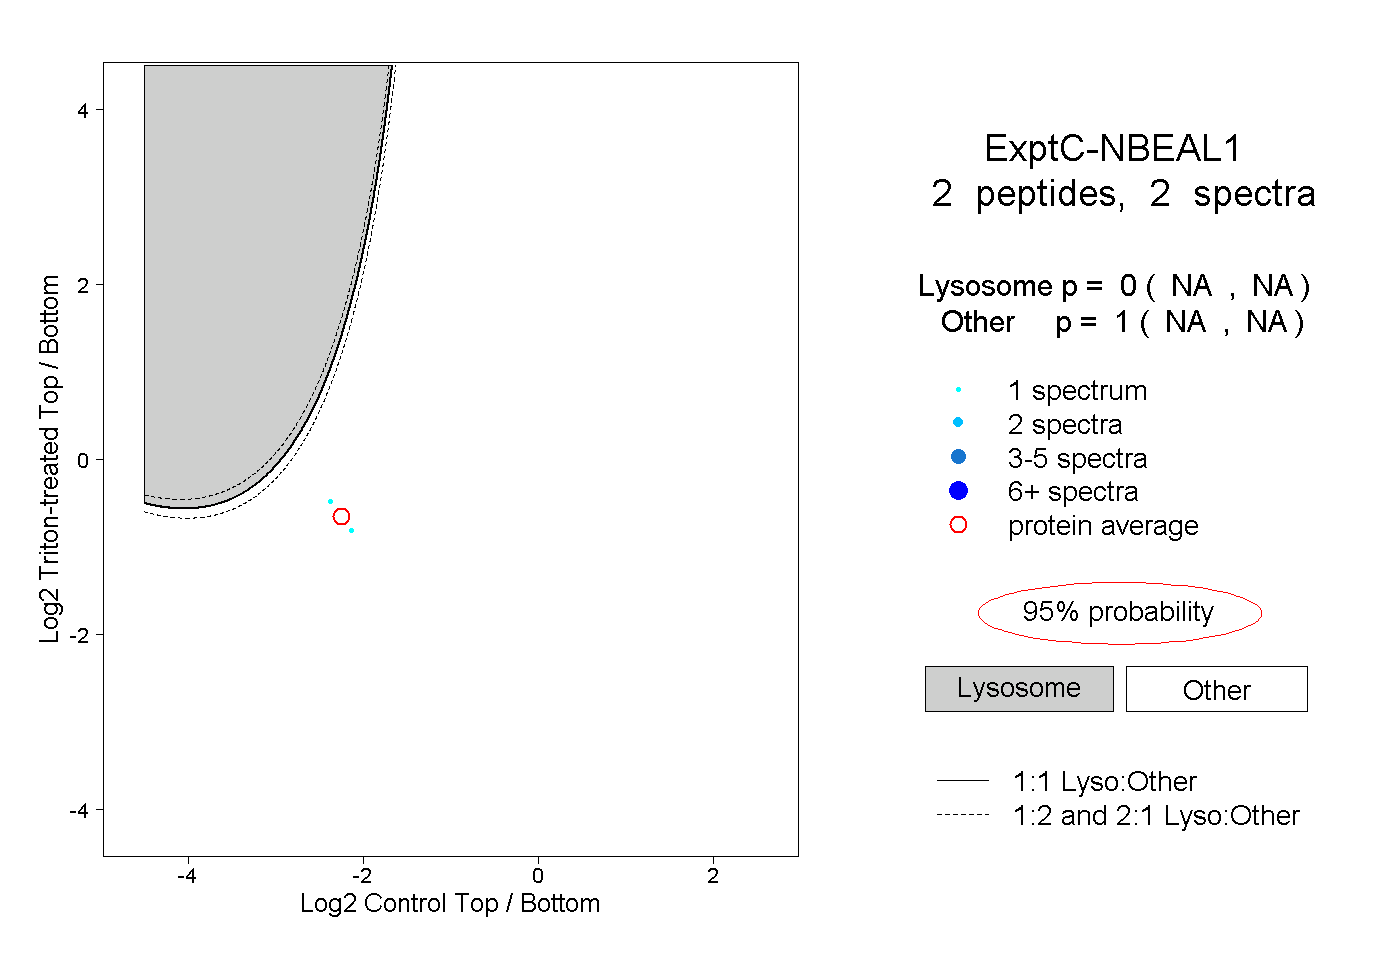 |
0.000 NA | NA |
1.000 NA | NA |