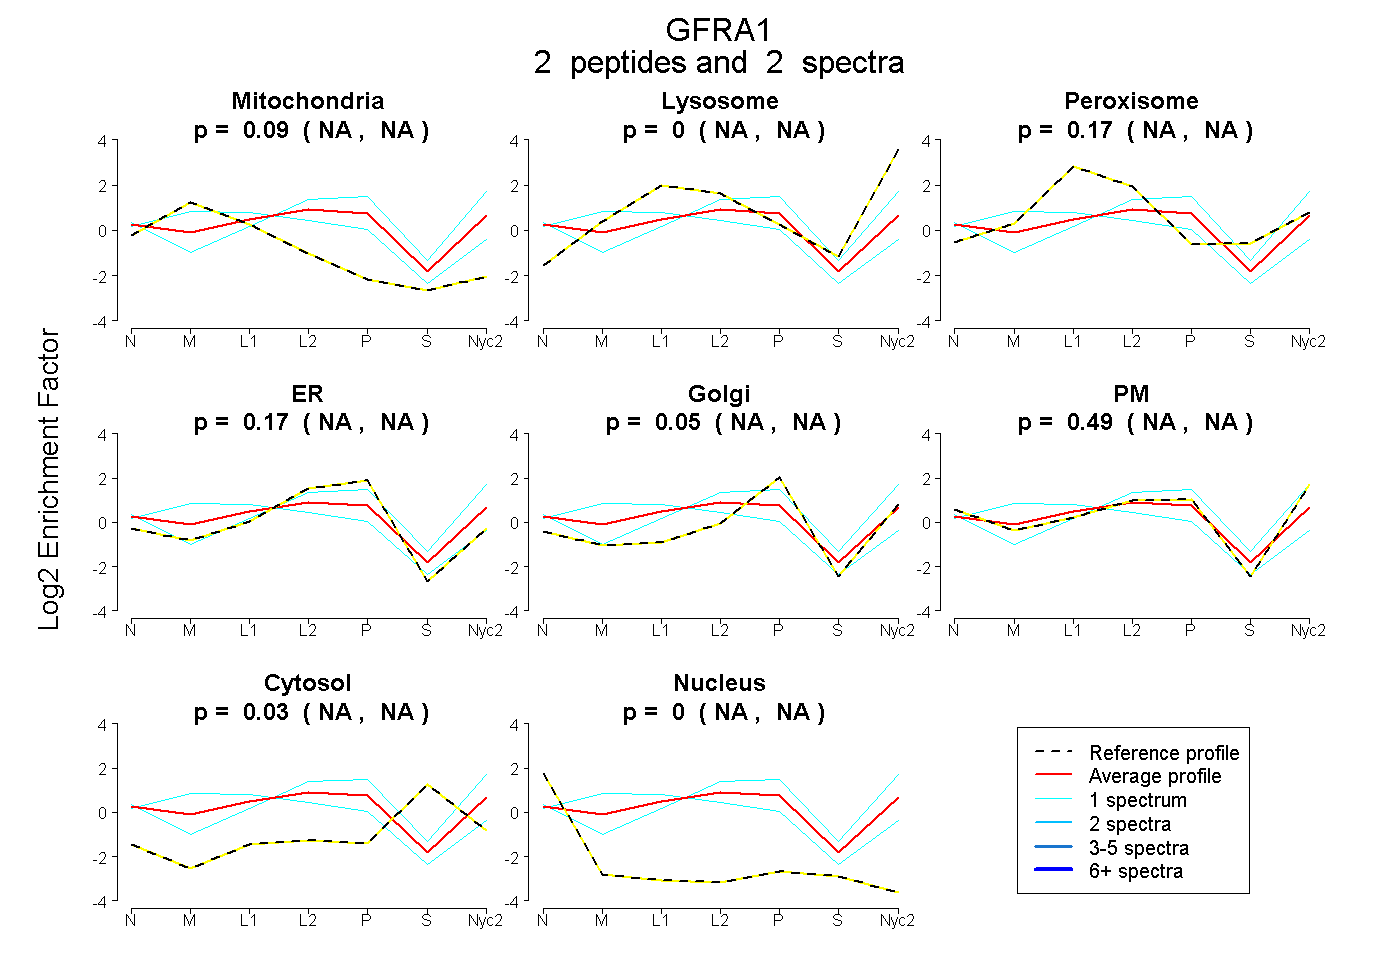
 2
2peptides
spectra
NA | NA
NA | NA
NA | NA
NA | NA
NA | NA
NA | NA
NA | NA
NA | NA
| Plot | Mito | Lyso | Perox | ER | Golgi | PM | Cytosol | Nucleus | |||||
| Expt A |
2 peptides |
2 spectra |
|
0.089 NA | NA |
0.000 NA | NA |
0.172 NA | NA |
0.174 NA | NA |
0.045 NA | NA |
0.488 NA | NA |
0.031 NA | NA |
0.000 NA | NA |
| 1 spectrum, FLNFFK | 0.000 | 0.122 | 0.000 | 0.143 | 0.011 | 0.641 | 0.082 | 0.000 | ||
| 1 spectrum, ACNLDDTCK | 0.390 | 0.000 | 0.156 | 0.199 | 0.000 | 0.255 | 0.000 | 0.000 |
| Plot | Lyso | Other | |||||||||||
| Expt C |
3 peptides |
6 spectra |
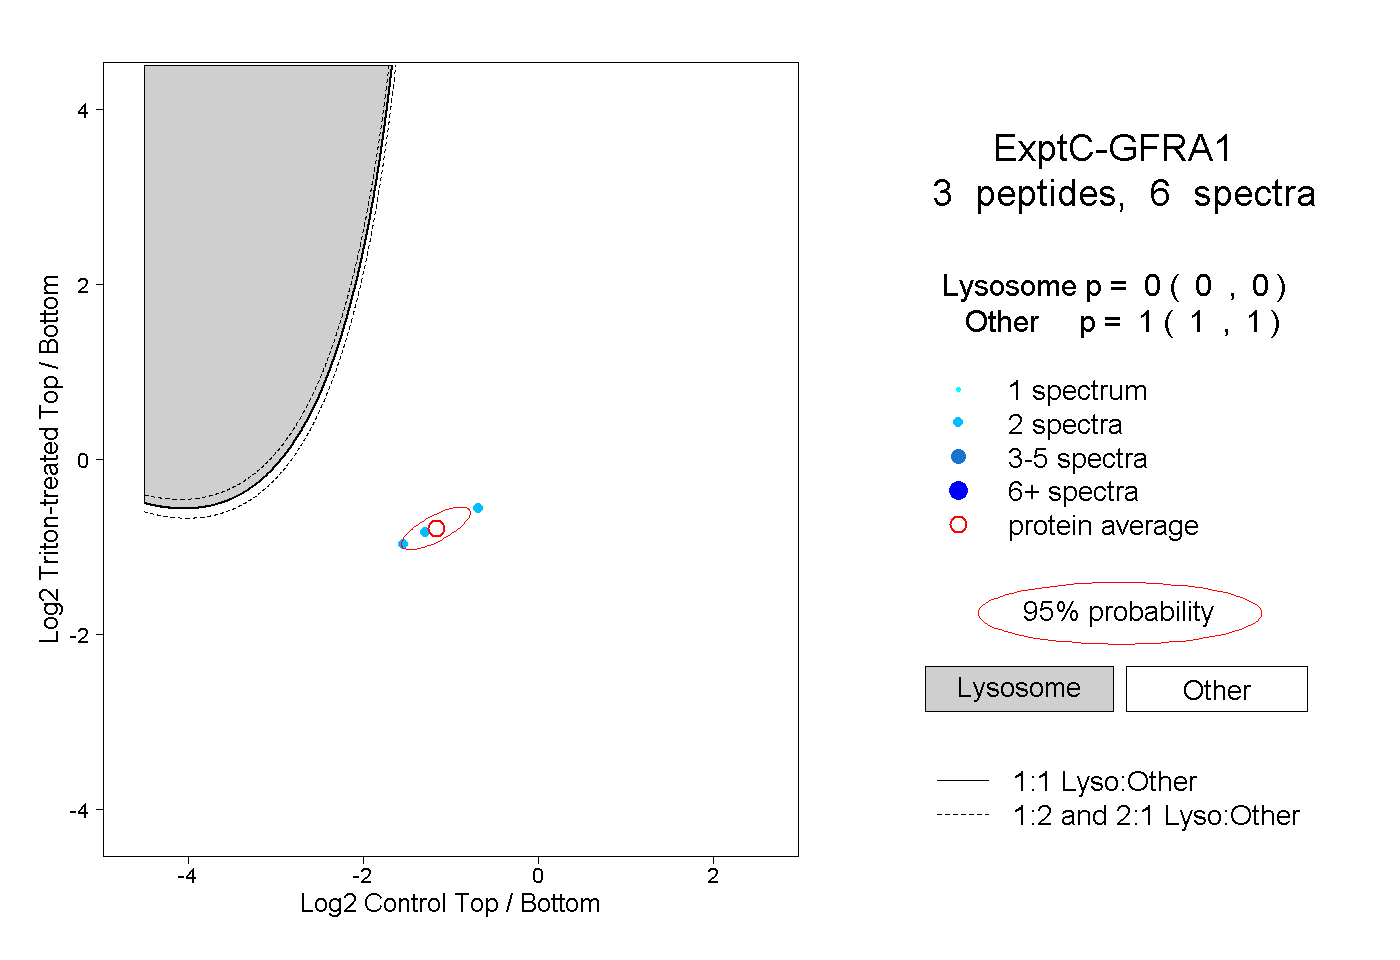 |
0.000 0.000 | 0.000 |
1.000 1.000 | 1.000 |