 2
2peptides
spectra
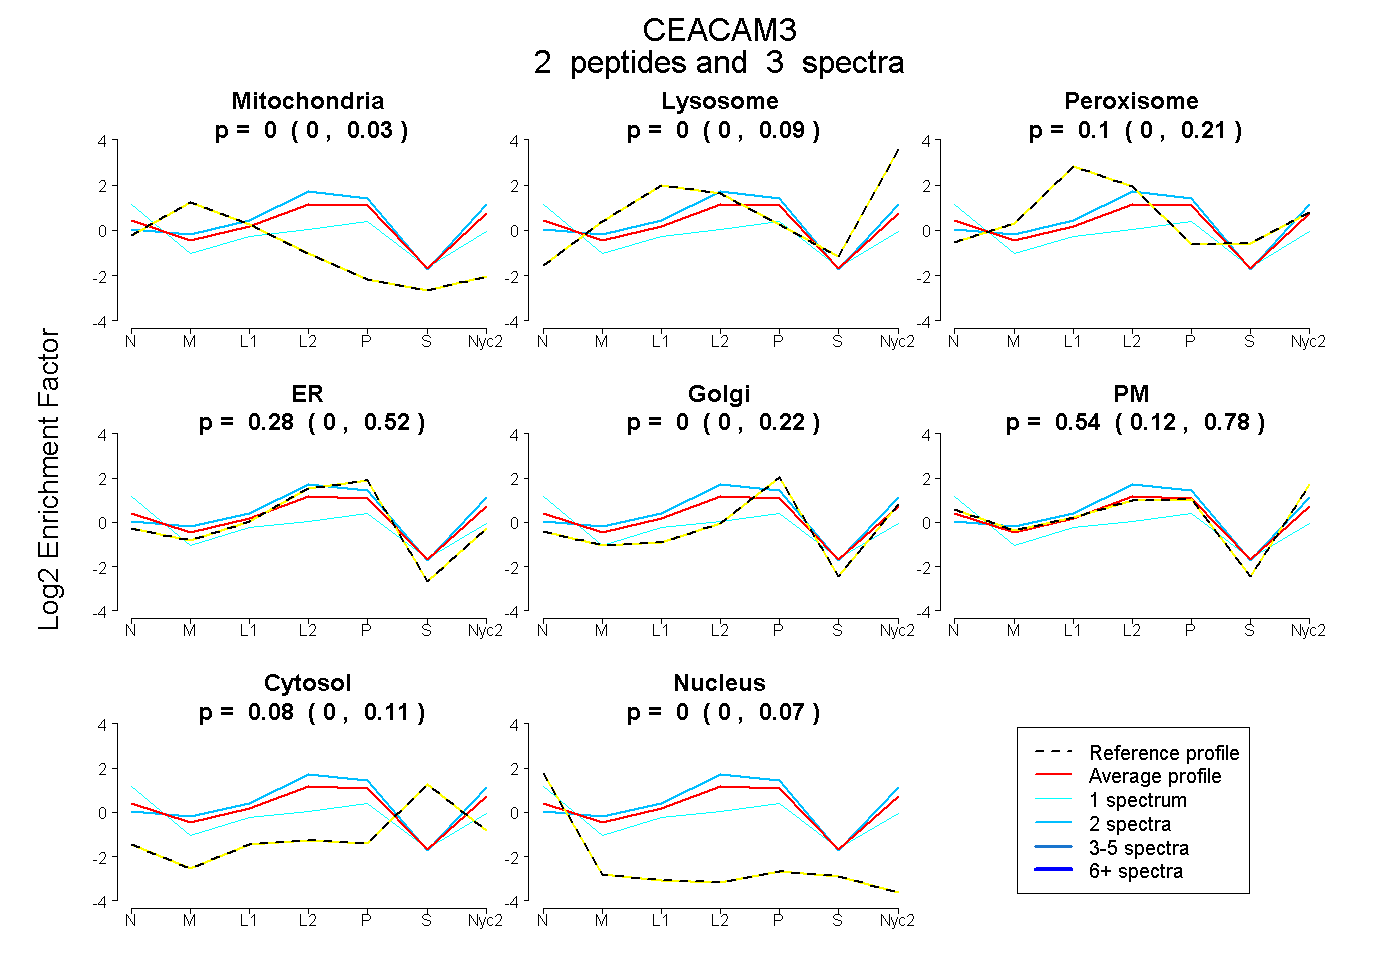
0.000 | 0.032
0.000 | 0.086
0.000 | 0.208
0.000 | 0.521
0.000 | 0.218
0.122 | 0.780
0.000 | 0.111
0.000 | 0.070
1peptide
spectra
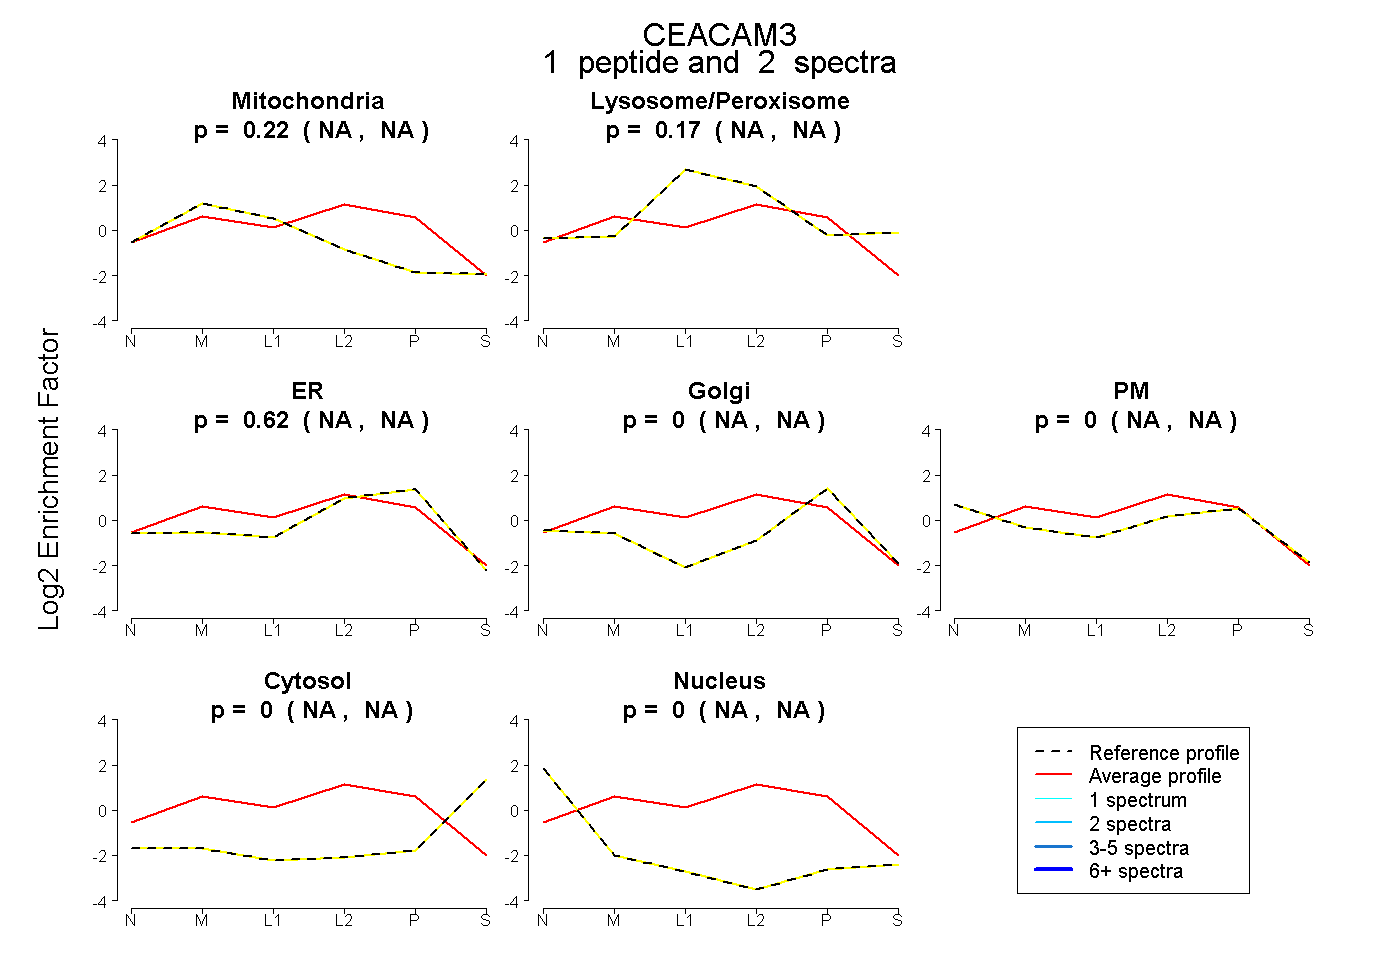
NA | NA
NA | NA
NA | NA
NA | NA
NA | NA
NA | NA
NA | NA
1peptide
spectra
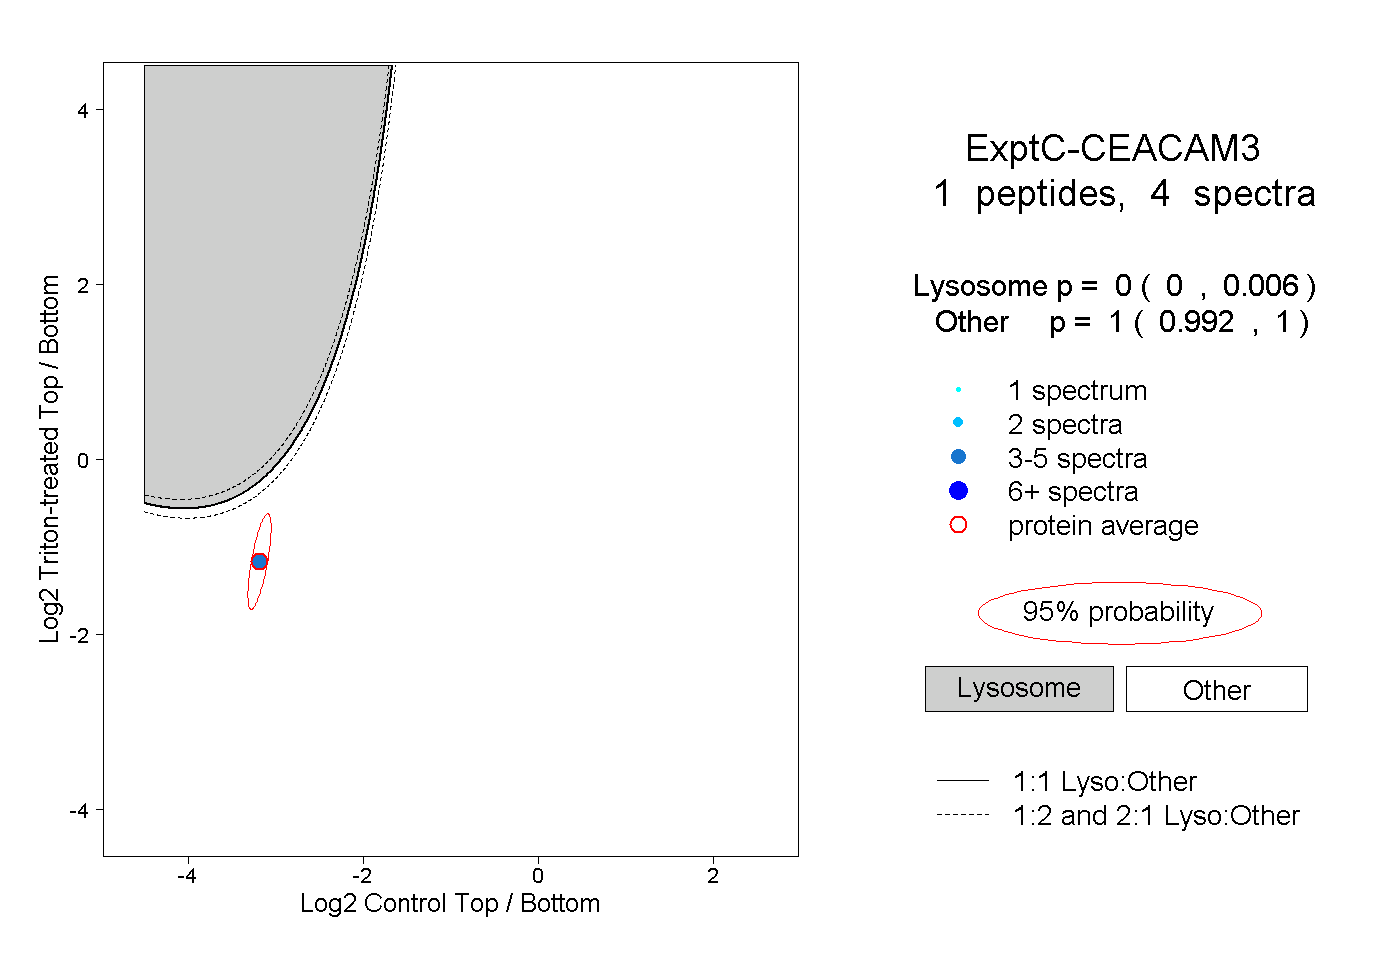
0.000 | 0.006
0.992 | 1.000
1peptide
spectra
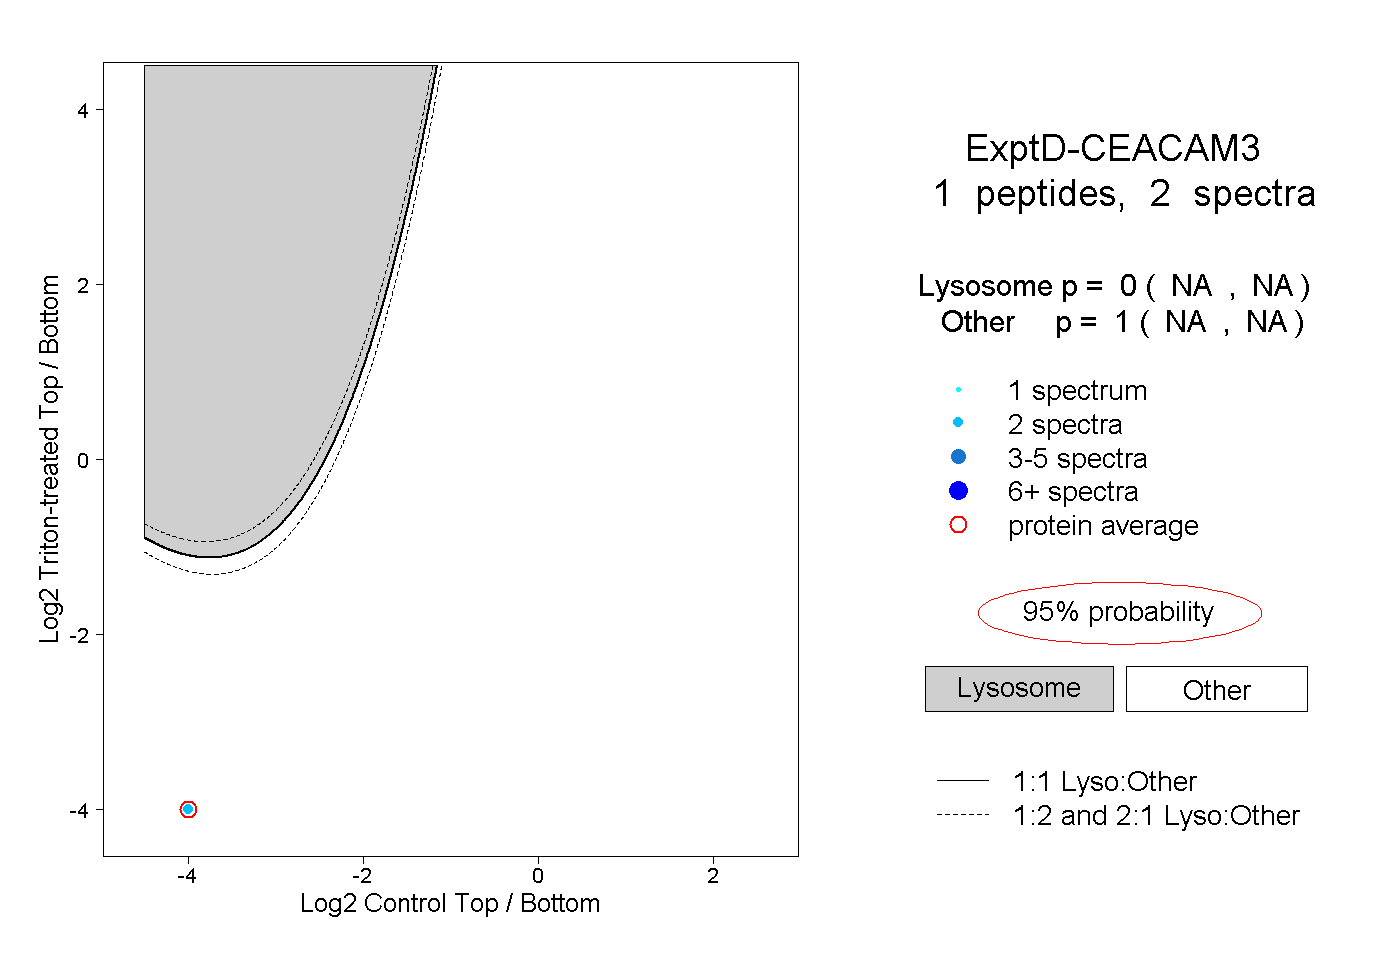
NA | NA
NA | NA