SRD5A1
[ENSRNOP00000023659]
Main page
| | | Plot |
Mito |
Lyso |
|
Perox |
ER |
Golgi |
PM |
Cytosol |
Nucleus |
|
| Expt A |
 6
6
peptides |
49
spectra |
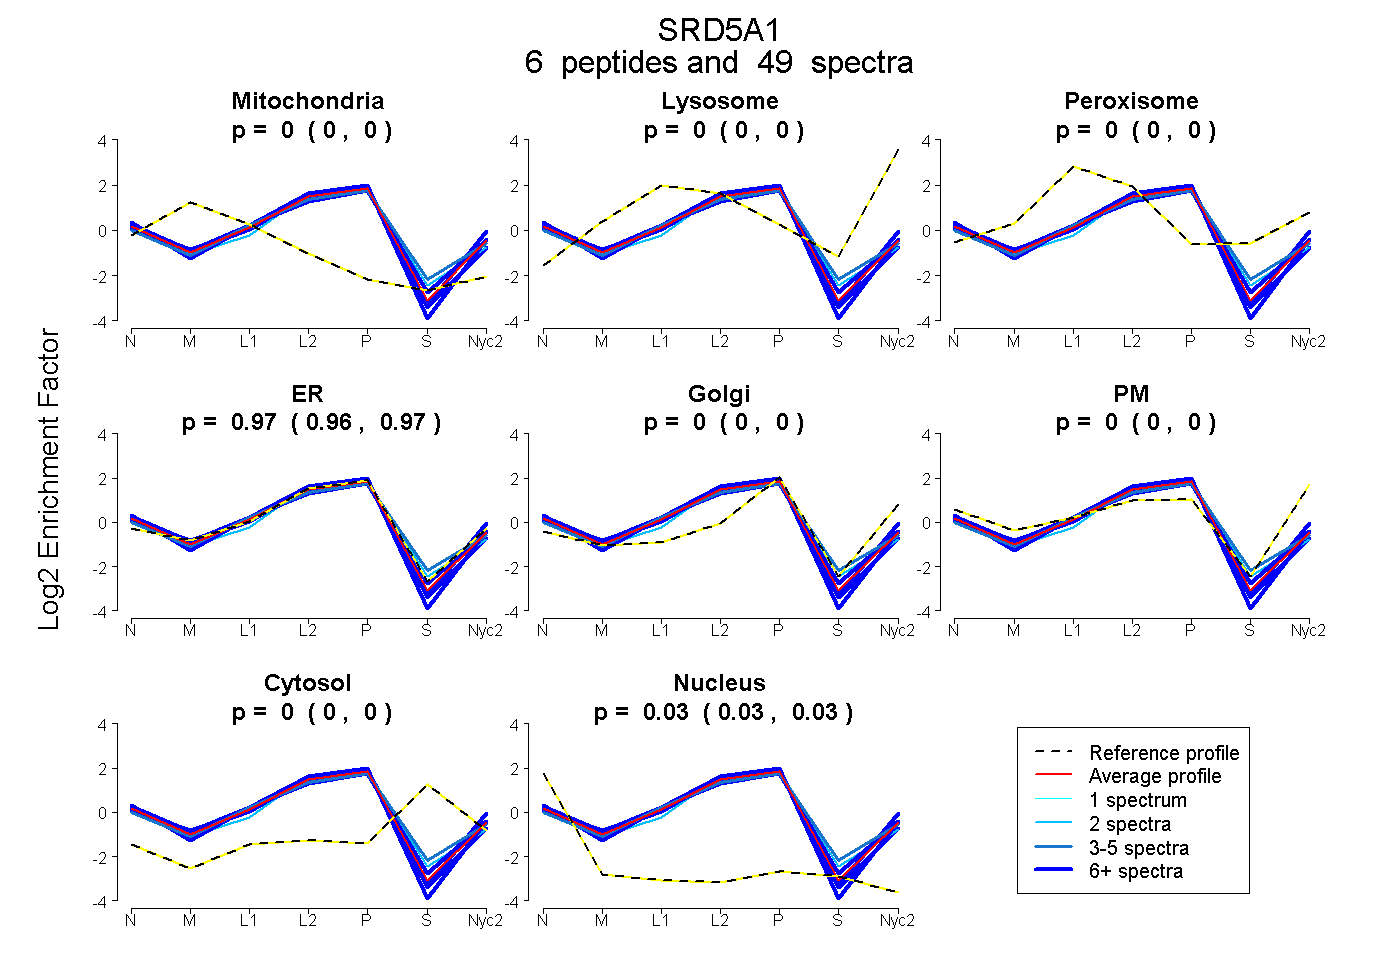 |
0.000
0.000 | 0.000 |
0.000
0.000 | 0.000 |
|
0.000
0.000 | 0.000 |
0.967
0.965 | 0.969 |
0.000
0.000 | 0.000 |
0.000
0.000 | 0.000 |
0.000
0.000 | 0.000 |
0.033
0.031 | 0.035 |
|
| | | Plot |
Mito |
|
Lyso or Perox |
|
ER |
Golgi |
PM |
Cytosol |
Nucleus |
|
| Expt B |
3
peptides |
9
spectra |
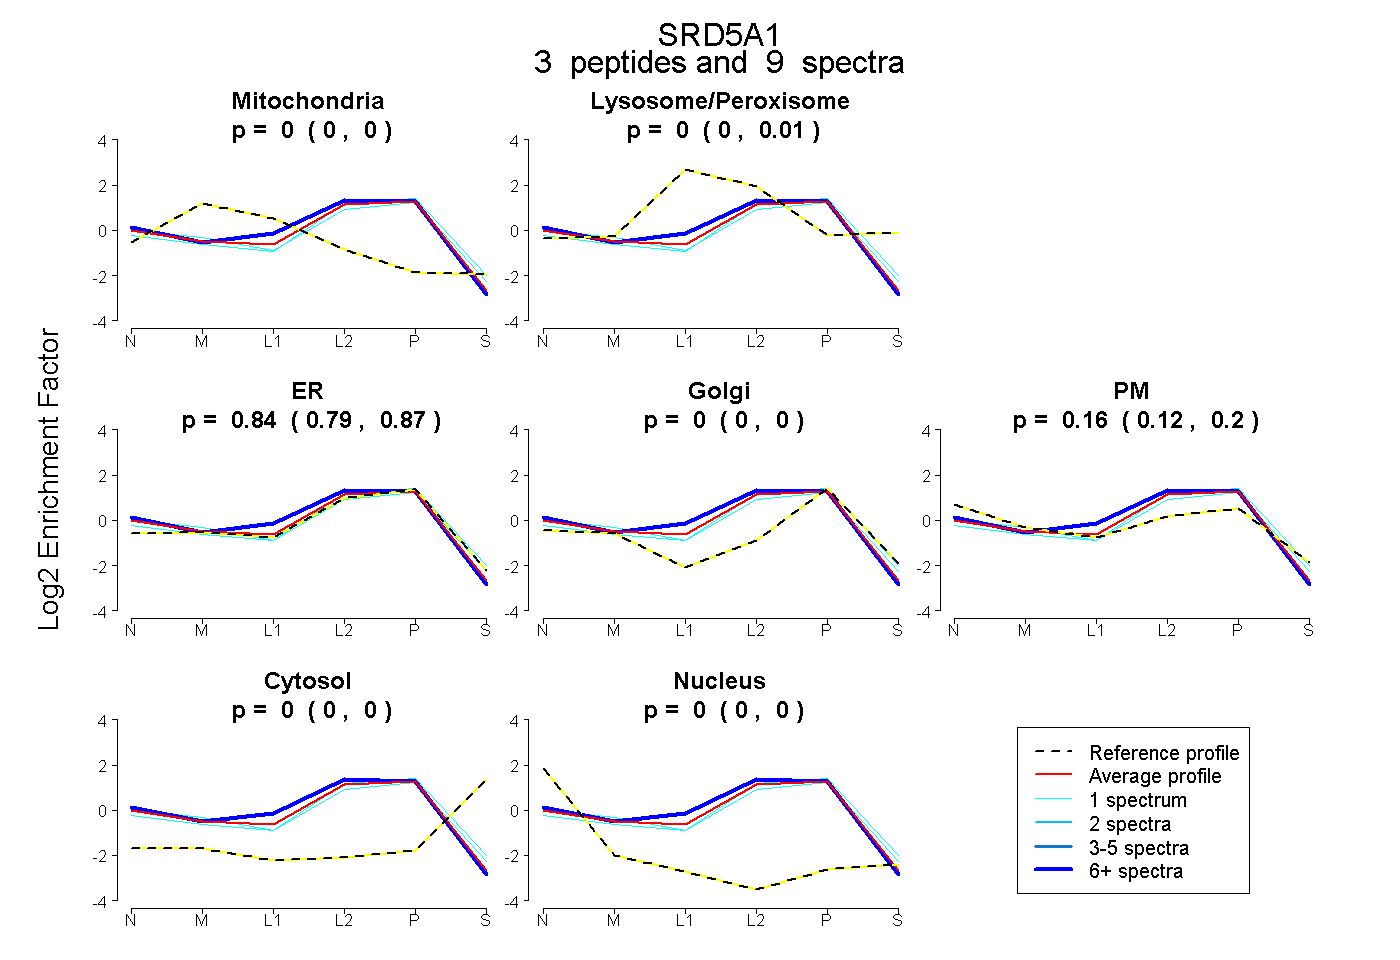 |
0.000
0.000 | 0.000 |
|
0.000
0.000 | 0.013 |
|
0.840
0.794 | 0.874 |
0.000
0.000 | 0.000 |
0.160
0.119 | 0.196 |
0.000
0.000 | 0.000 |
0.000
0.000 | 0.000 |
|
| 7 spectra, TLVFPVLIR |
0.000 |
|
0.069 |
|
0.805 |
0.000 |
0.127 |
0.000 |
0.000 |
|
| 1 spectrum, SVGSPYGR |
0.000 |
|
0.000 |
|
0.689 |
0.000 |
0.311 |
0.000 |
0.000 |
|
| 1 spectrum, FEDYPK |
0.000 |
|
0.002 |
|
0.905 |
0.000 |
0.094 |
0.000 |
0.000 |
|
| | | Plot |
|
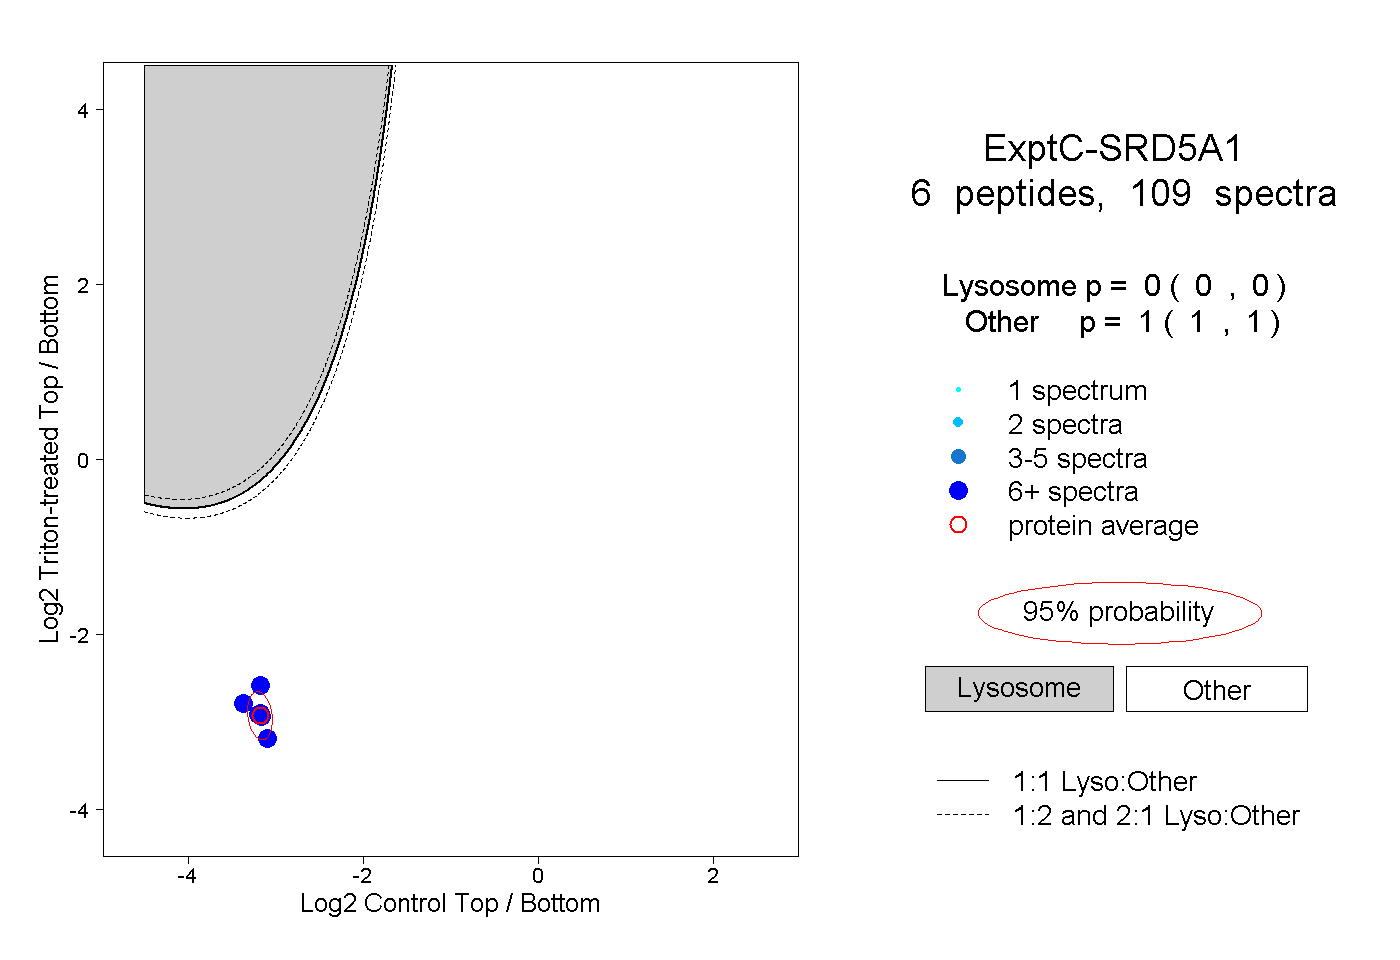
Lyso |
|
|
|
|
|
|
|
Other |
| Expt C |
6
peptides |
109
spectra |
 |
|
0.000
0.000 | 0.000 |
|
|
|
|
|
|
|
1.000
1.000 | 1.000 |
| | | Plot |
|
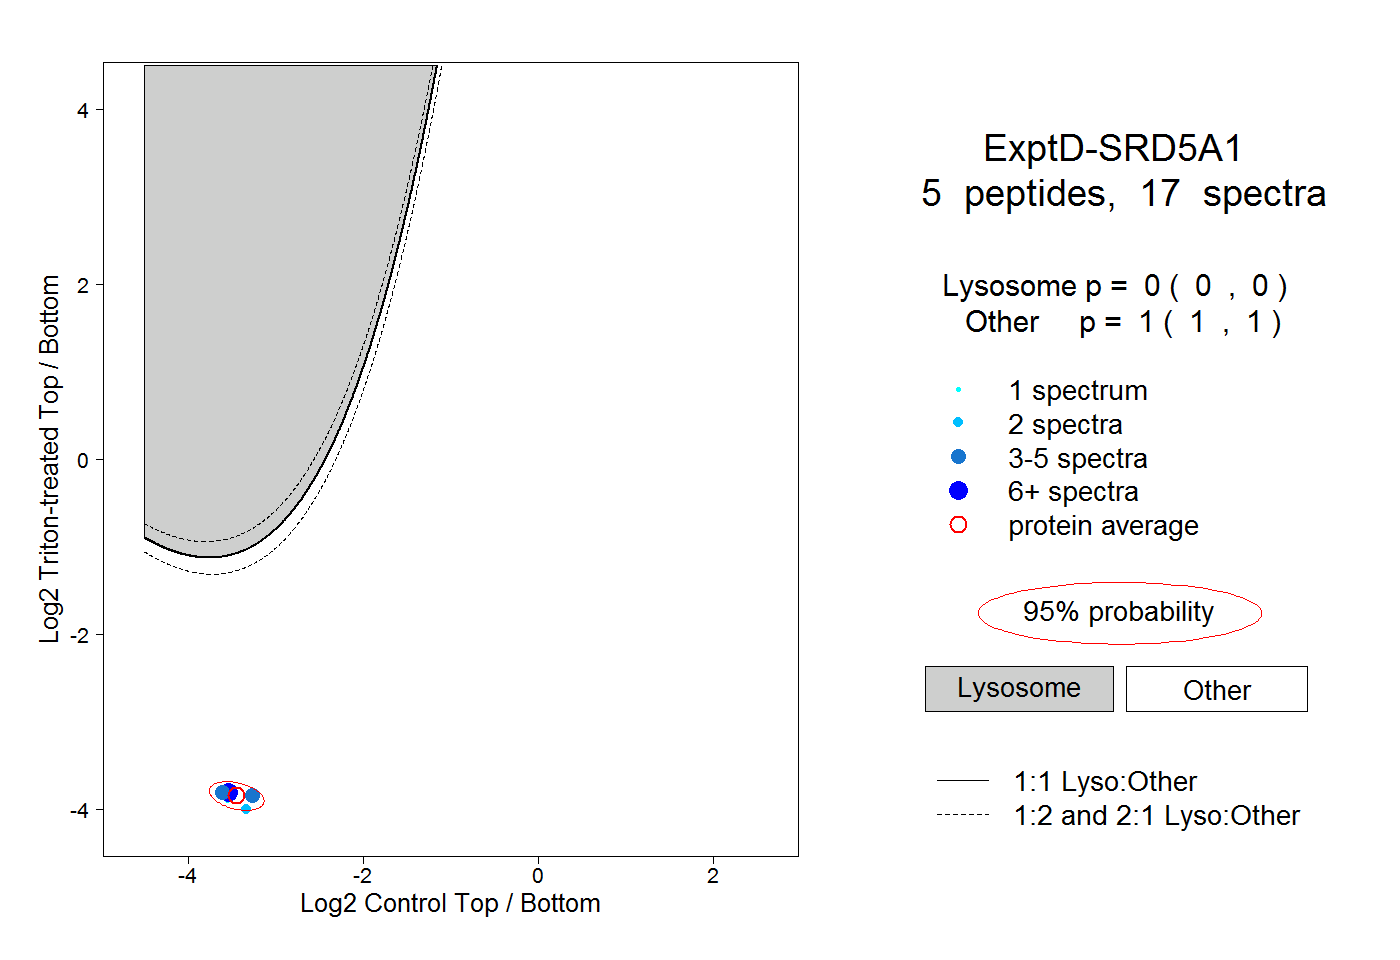
Lyso |
|
|
|
|
|
|
|
Other |
| Expt D |
5
peptides |
17
spectra |
 |
|
0.000
0.000 | 0.000 |
|
|
|
|
|
|
|
1.000
1.000 | 1.000 |