 6
6peptides
spectra
0.000 | 0.000
0.000 | 0.000
0.000 | 0.000
0.965 | 0.969
0.000 | 0.000
0.000 | 0.000
0.000 | 0.000
0.031 | 0.035
| Plot | Mito | Lyso | Perox | ER | Golgi | PM | Cytosol | Nucleus | |||||
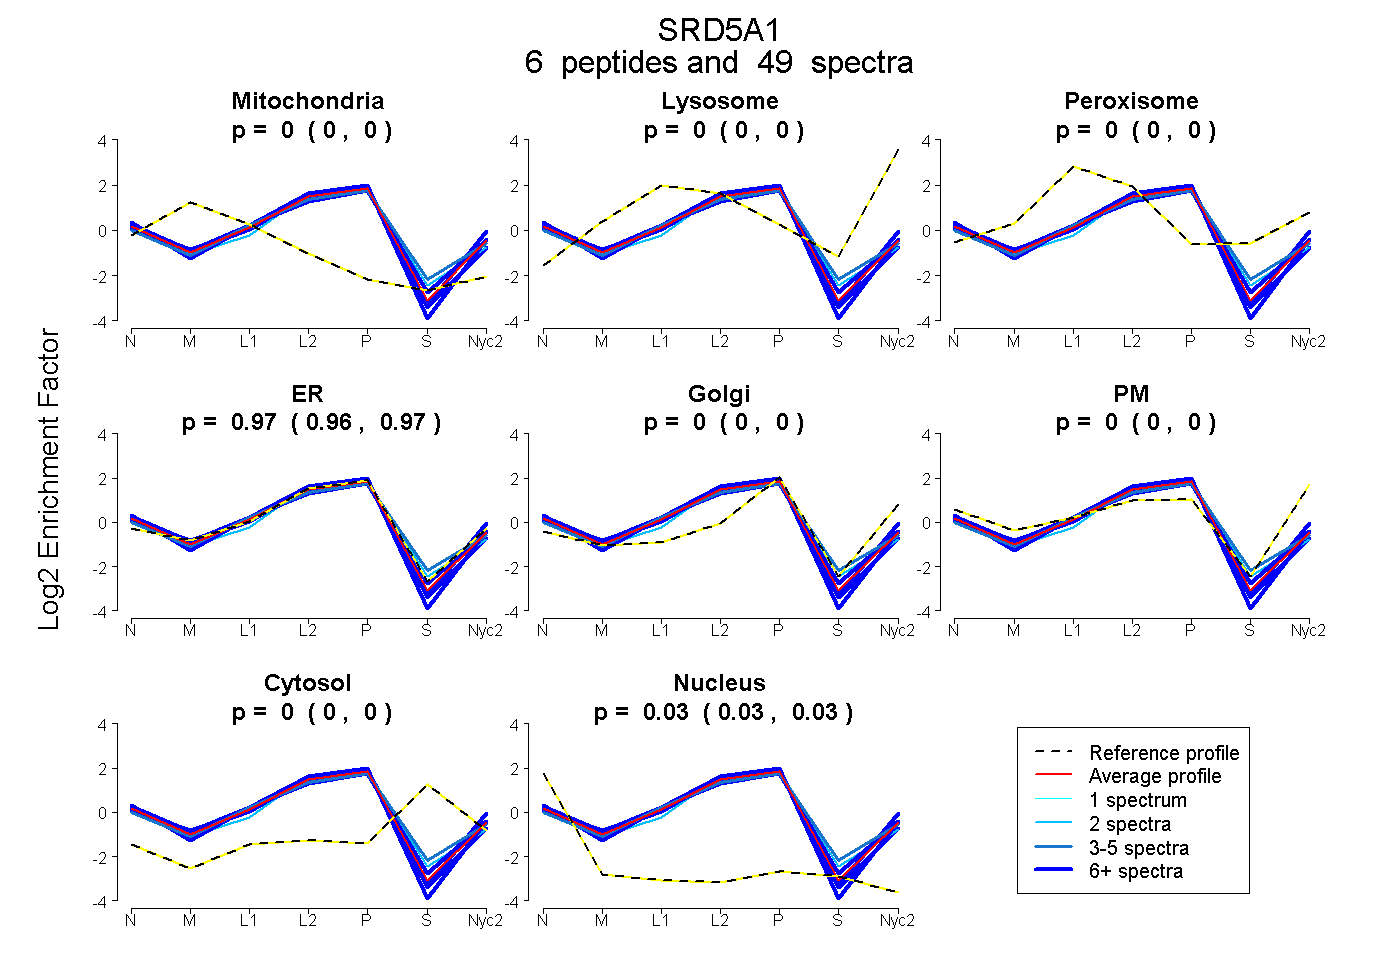
| Expt A |
6 peptides |
49 spectra |
|
0.000 0.000 | 0.000 |
0.000 0.000 | 0.000 |
0.000 0.000 | 0.000 |
0.967 0.965 | 0.969 |
0.000 0.000 | 0.000 |
0.000 0.000 | 0.000 |
0.000 0.000 | 0.000 |
0.033 0.031 | 0.035 |
| 5 spectra, YSPQWPGIR | 0.000 | 0.000 | 0.045 | 0.888 | 0.000 | 0.000 | 0.038 | 0.029 | ||
| 9 spectra, TLVFPVLIR | 0.000 | 0.000 | 0.000 | 0.975 | 0.000 | 0.000 | 0.000 | 0.025 | ||
| 14 spectra, SVGSPYGR | 0.000 | 0.000 | 0.002 | 0.892 | 0.000 | 0.062 | 0.000 | 0.044 | ||
| 2 spectra, KPGETGYK | 0.000 | 0.000 | 0.000 | 0.948 | 0.000 | 0.000 | 0.000 | 0.052 | ||
| 8 spectra, LGNLPNR | 0.000 | 0.000 | 0.000 | 0.893 | 0.000 | 0.103 | 0.000 | 0.003 | ||
| 11 spectra, FEDYPK | 0.000 | 0.000 | 0.000 | 0.960 | 0.000 | 0.000 | 0.000 | 0.040 |
| Plot | Mito | Lyso or Perox | ER | Golgi | PM | Cytosol | Nucleus | ||||||
| Expt B |
3 peptides |
9 spectra |
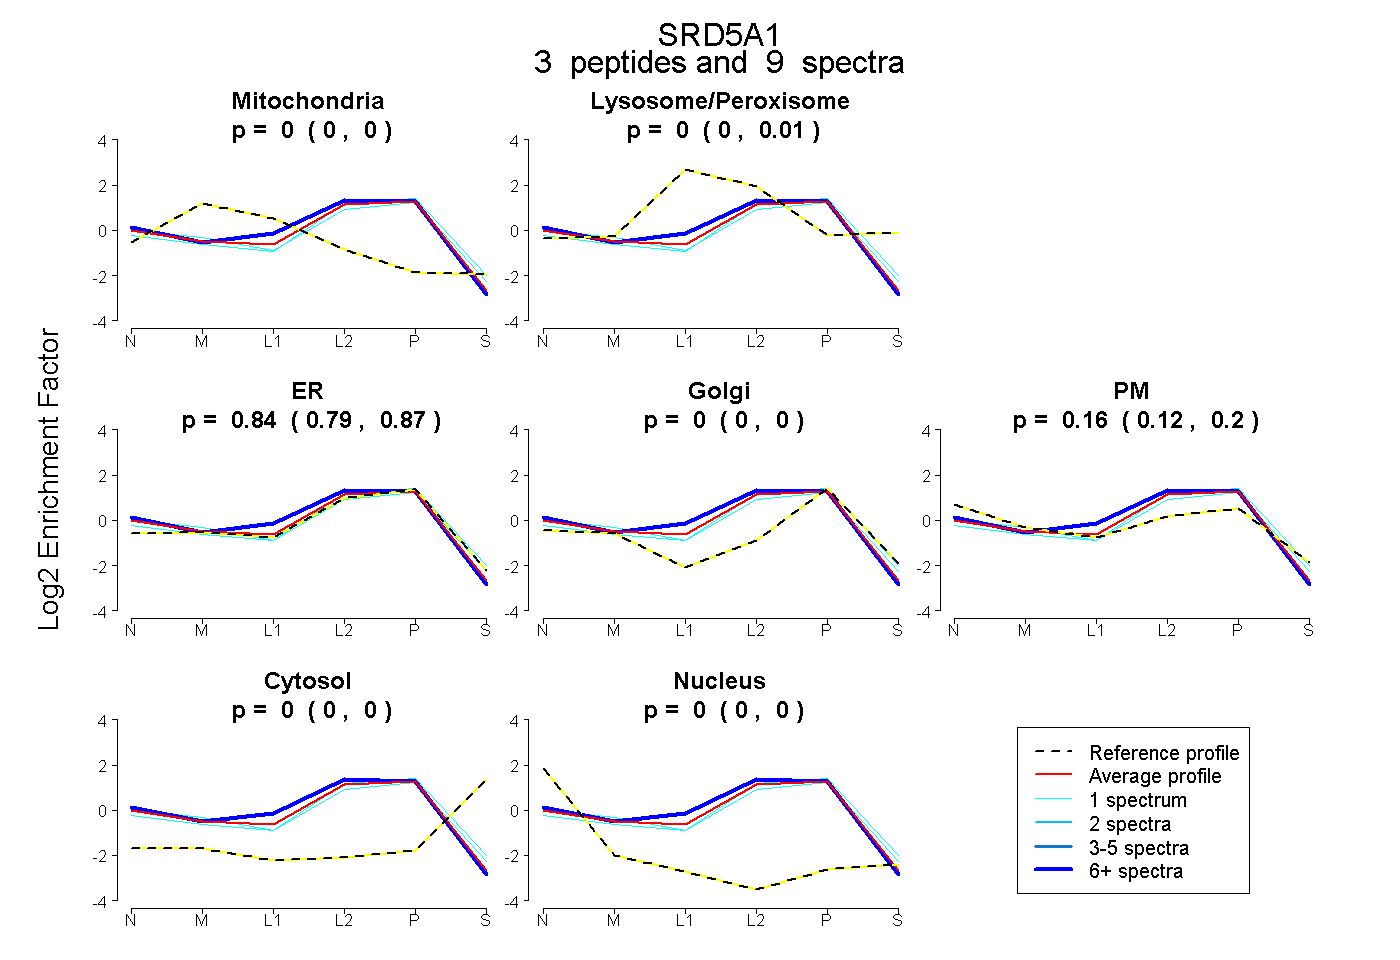 |
0.000 0.000 | 0.000 |
0.000 0.000 | 0.013 |
0.840 0.794 | 0.874 |
0.000 0.000 | 0.000 |
0.160 0.119 | 0.196 |
0.000 0.000 | 0.000 |
0.000 0.000 | 0.000 |
|||
| Plot | Lyso | Other | |||||||||||
| Expt C |
6 peptides |
109 spectra |
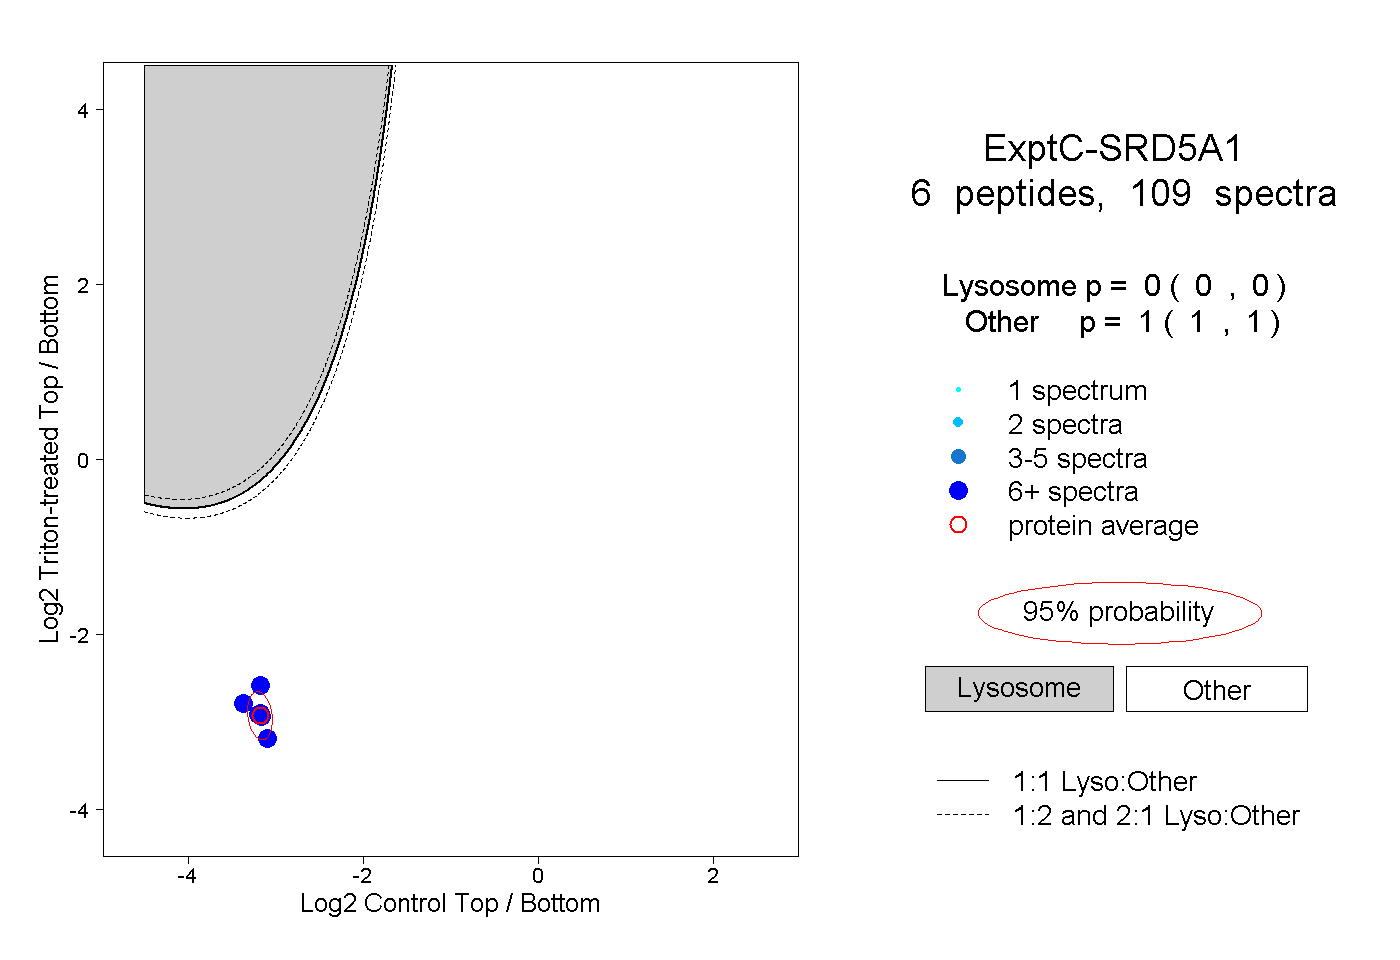 |
0.000 0.000 | 0.000 |
1.000 1.000 | 1.000 |
||||||||
| Plot | Lyso | Other | |||||||||||
| Expt D |
5 peptides |
17 spectra |
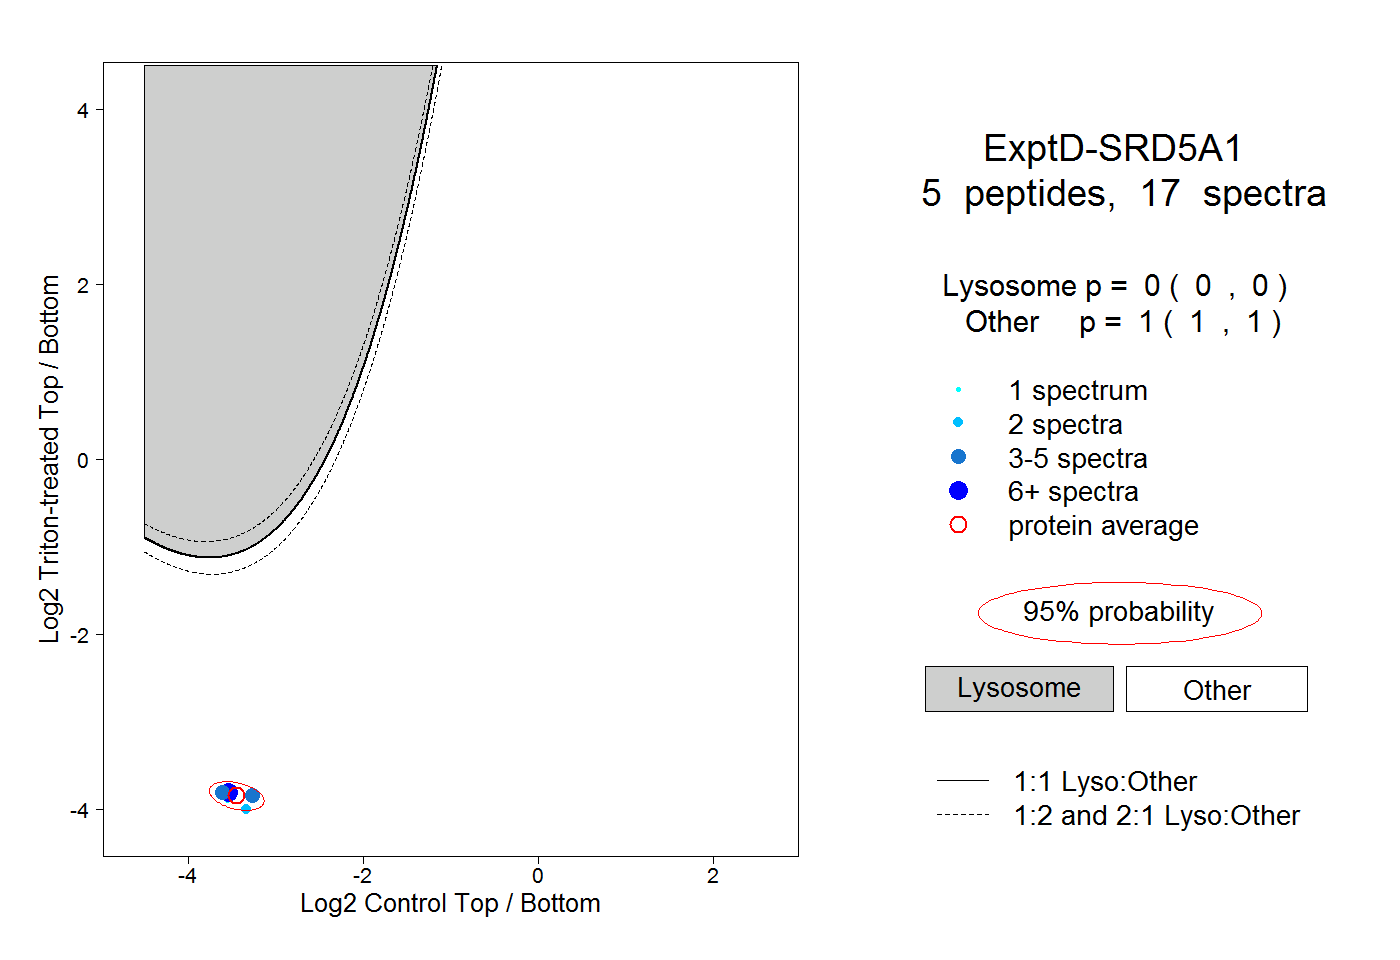 |
0.000 0.000 | 0.000 |
1.000 1.000 | 1.000 |