14
14peptides
spectra
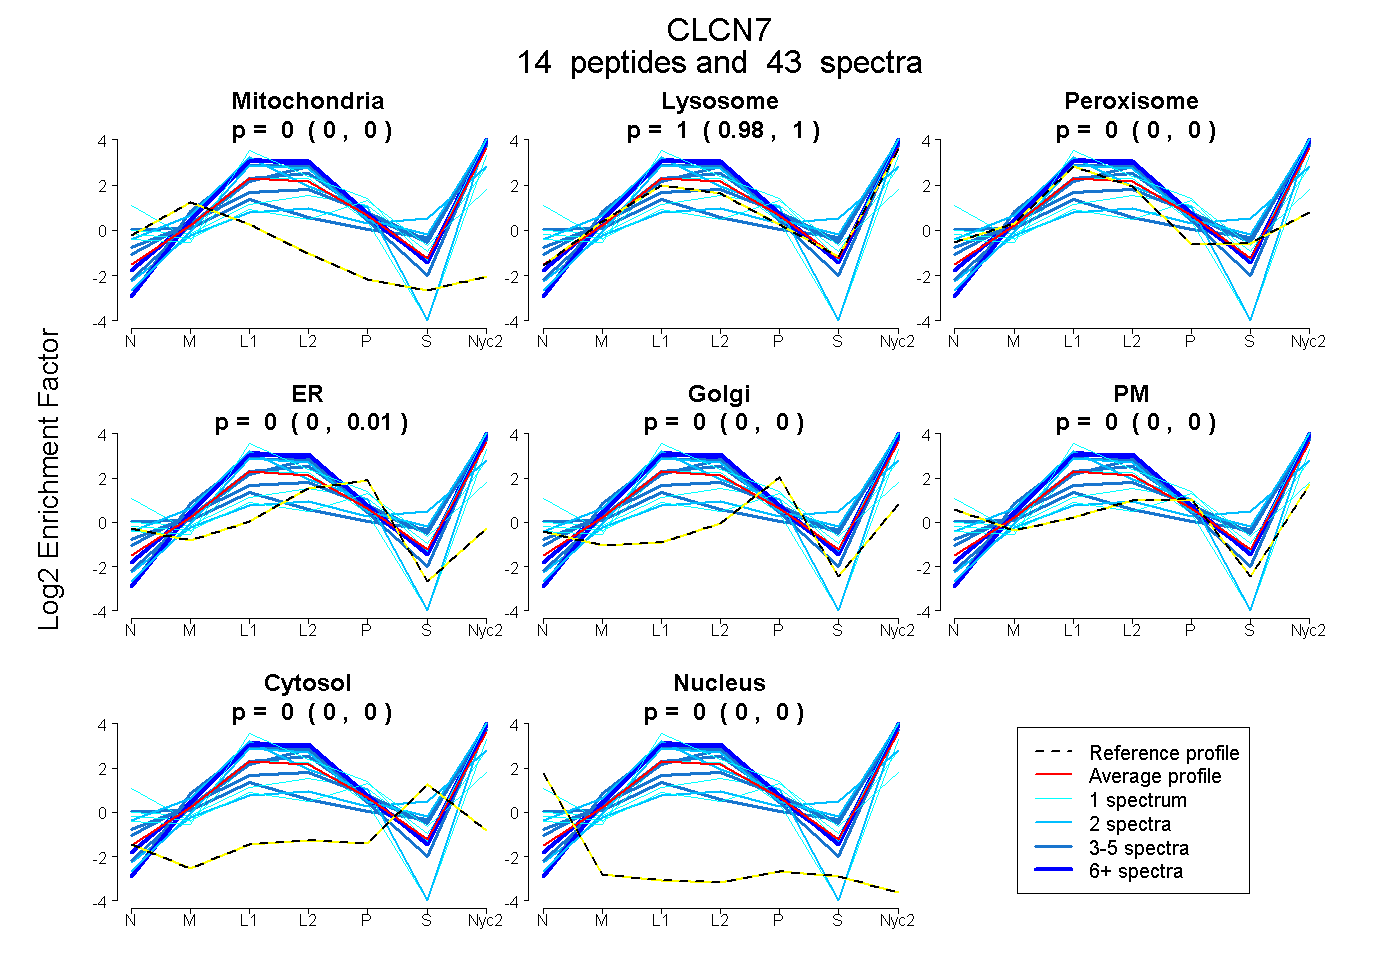
0.000 | 0.000
0.985 | 1.000
0.000 | 0.002
0.000 | 0.012
0.000 | 0.000
0.000 | 0.000
0.000 | 0.000
0.000 | 0.000
8peptides
spectra
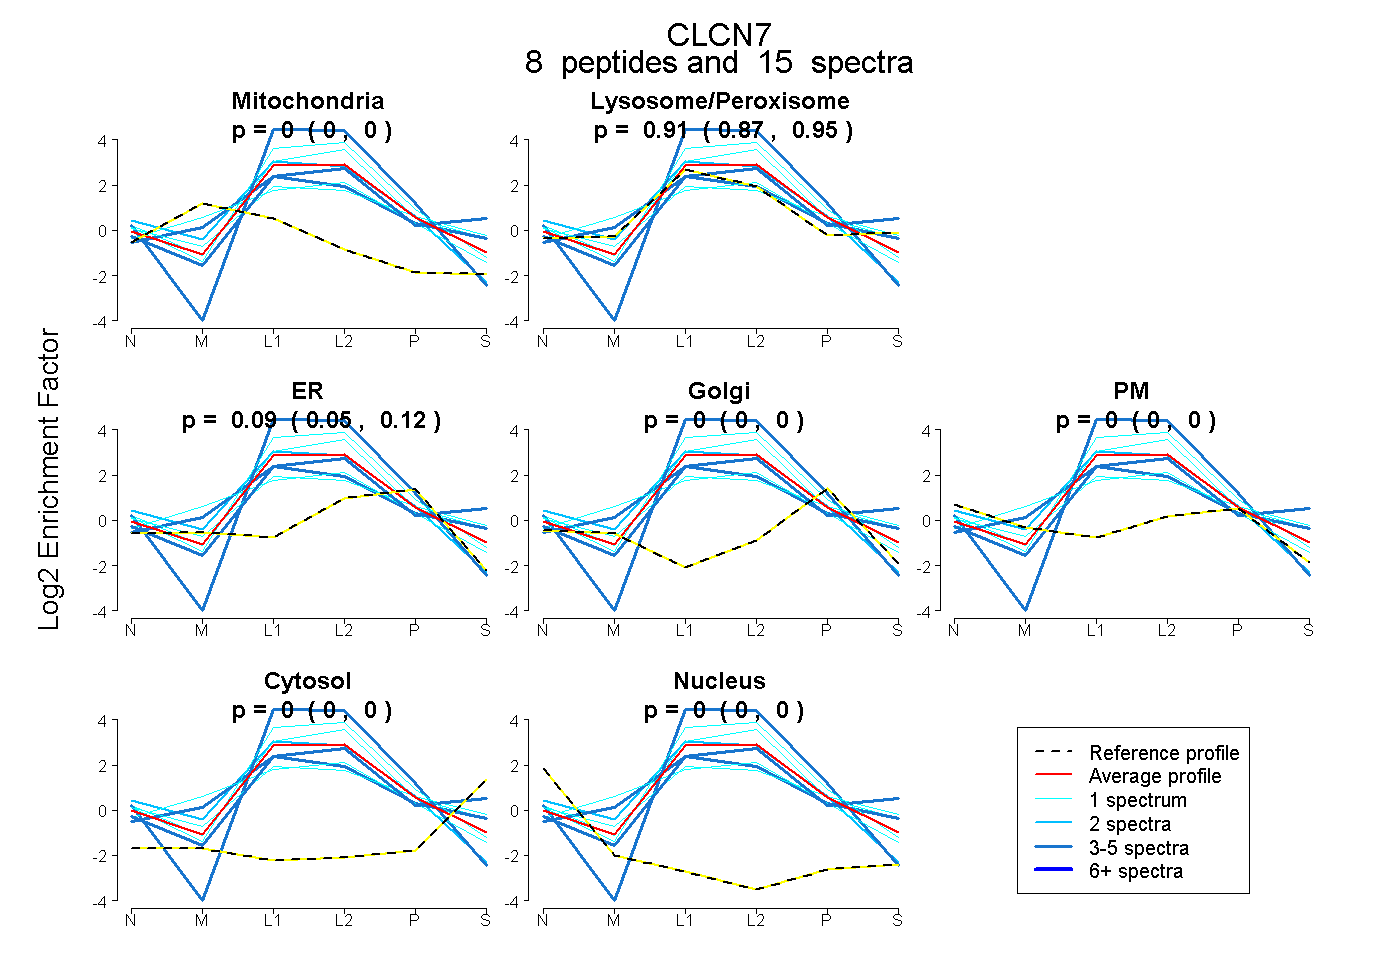
0.000 | 0.000
0.874 | 0.946
0.047 | 0.121
0.000 | 0.000
0.000 | 0.000
0.000 | 0.000
0.000 | 0.000
17peptides
spectra
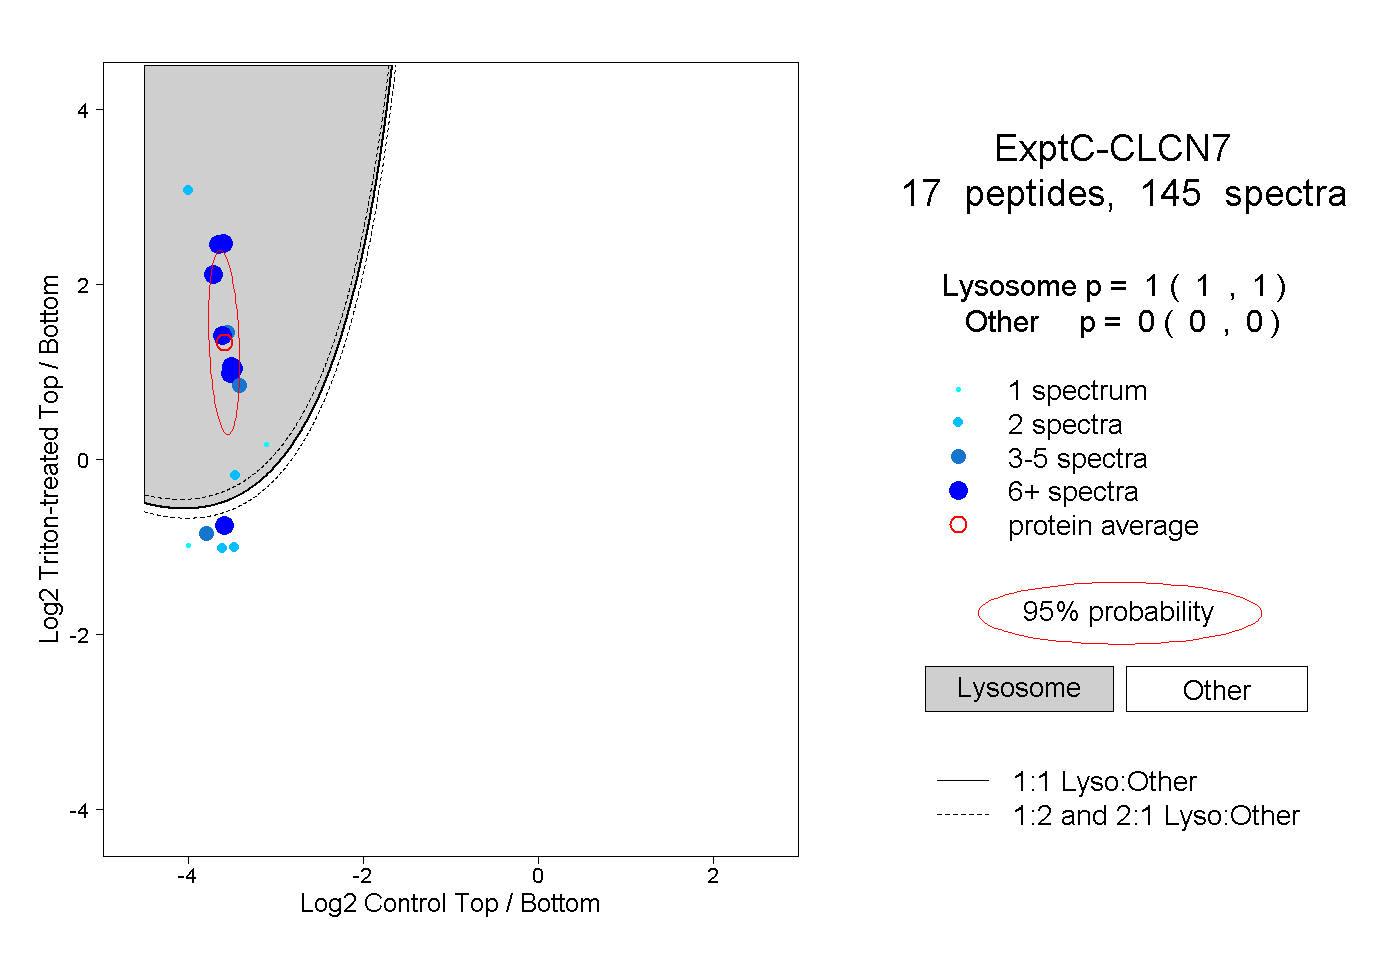
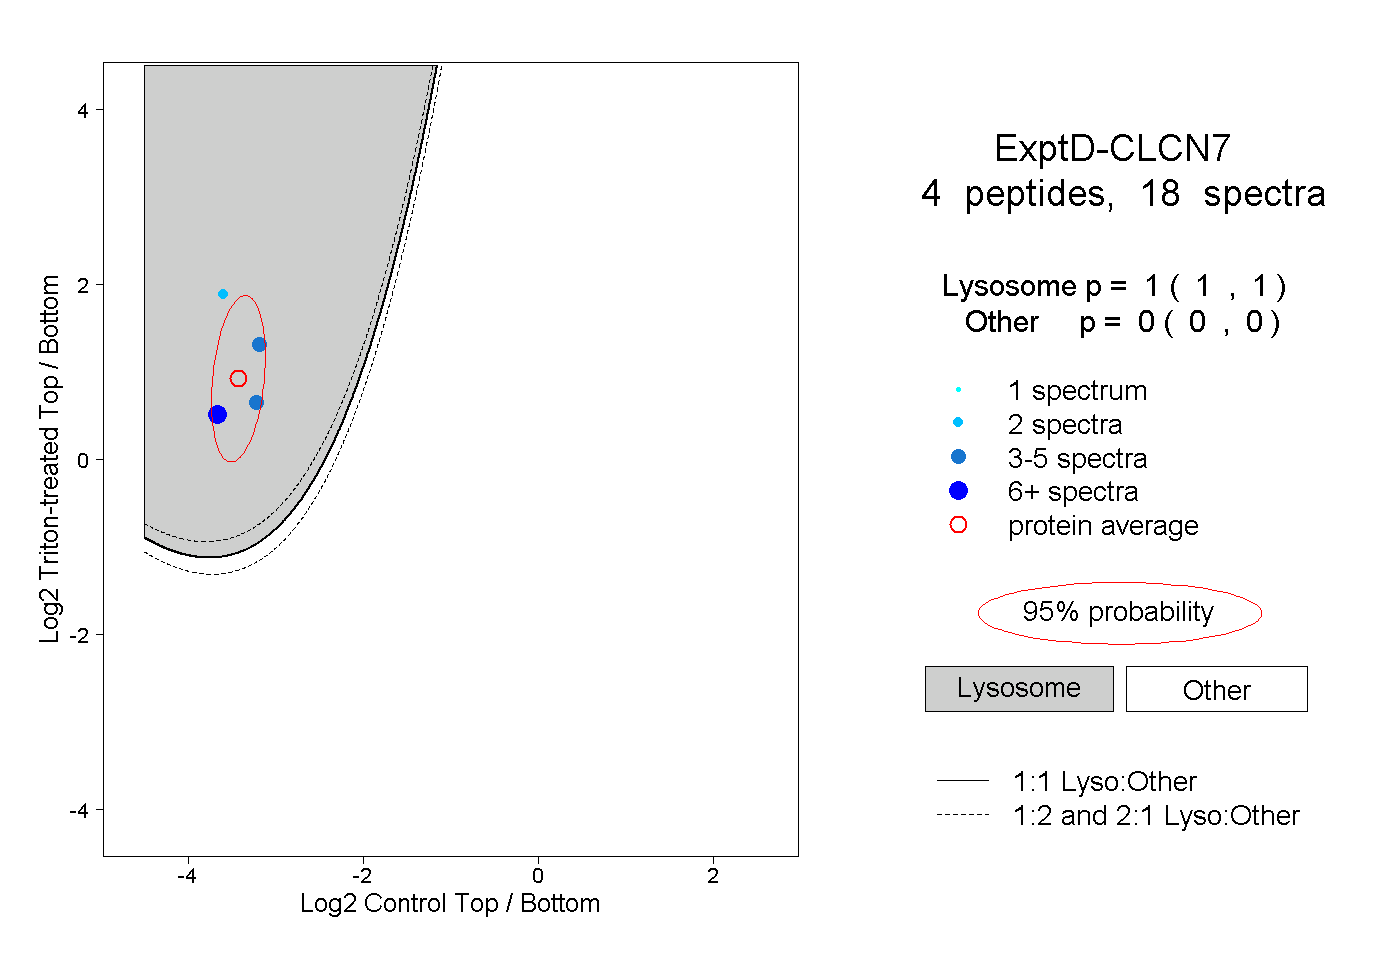
1.000 | 1.000
0.000 | 0.000