 14
14peptides
spectra
0.000 | 0.000
0.985 | 1.000
0.000 | 0.002
0.000 | 0.012
0.000 | 0.000
0.000 | 0.000
0.000 | 0.000
0.000 | 0.000
| Plot | Mito | Lyso | Perox | ER | Golgi | PM | Cytosol | Nucleus | |||||
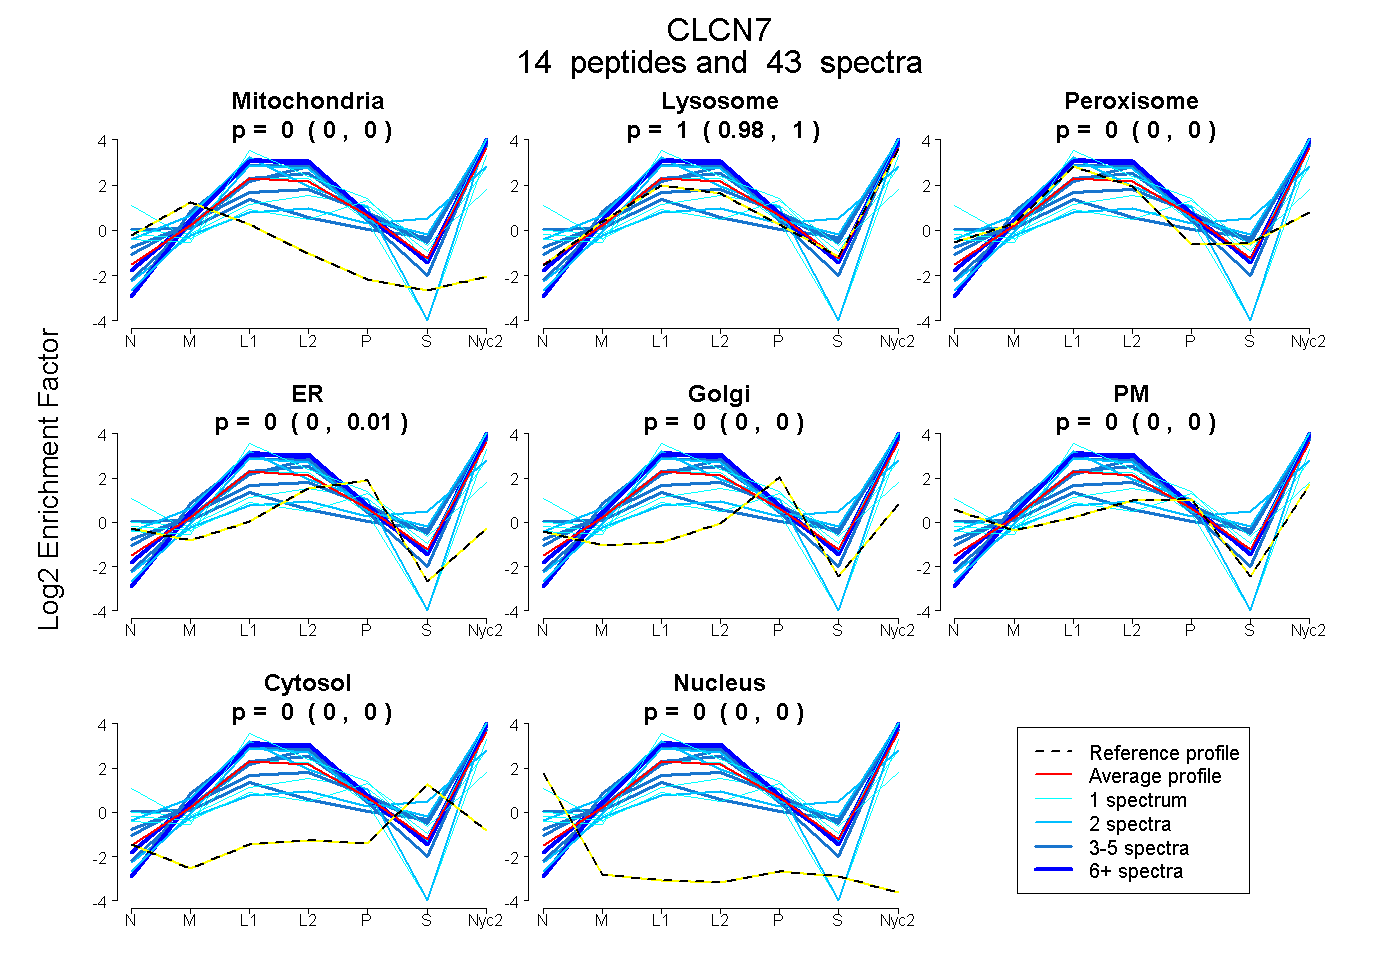
| Expt A |
14 peptides |
43 spectra |
|
0.000 0.000 | 0.000 |
0.997 0.985 | 1.000 |
0.000 0.000 | 0.002 |
0.003 0.000 | 0.012 |
0.000 0.000 | 0.000 |
0.000 0.000 | 0.000 |
0.000 0.000 | 0.000 |
0.000 0.000 | 0.000 |
| 9 spectra, SNMGLVQR | 0.000 | 1.000 | 0.000 | 0.000 | 0.000 | 0.000 | 0.000 | 0.000 | ||
| 3 spectra, IPHVVR | 0.000 | 1.000 | 0.000 | 0.000 | 0.000 | 0.000 | 0.000 | 0.000 | ||
| 2 spectra, SQLIVLLK | 0.000 | 1.000 | 0.000 | 0.000 | 0.000 | 0.000 | 0.000 | 0.000 | ||
| 4 spectra, LQGLILR | 0.000 | 0.957 | 0.000 | 0.000 | 0.000 | 0.043 | 0.000 | 0.000 | ||
| 5 spectra, IFEYFR | 0.000 | 1.000 | 0.000 | 0.000 | 0.000 | 0.000 | 0.000 | 0.000 | ||
| 3 spectra, EGPMIHSGSVIAAGISQGR | 0.000 | 0.742 | 0.000 | 0.000 | 0.000 | 0.160 | 0.097 | 0.000 | ||
| 1 spectrum, GGLEELSLAQT | 0.000 | 0.340 | 0.000 | 0.000 | 0.000 | 0.660 | 0.000 | 0.000 | ||
| 1 spectrum, YALMGAAAQLGGIVR | 0.000 | 0.305 | 0.158 | 0.000 | 0.324 | 0.130 | 0.083 | 0.000 | ||
| 6 spectra, EVMSTPVTCLR | 0.000 | 1.000 | 0.000 | 0.000 | 0.000 | 0.000 | 0.000 | 0.000 | ||
| 1 spectrum, EIPHNEK | 0.000 | 0.491 | 0.026 | 0.000 | 0.000 | 0.476 | 0.006 | 0.000 | ||
| 2 spectra, HLVVVDNHNQVVGLVTR | 0.000 | 0.732 | 0.000 | 0.000 | 0.000 | 0.000 | 0.268 | 0.000 | ||
| 1 spectrum, VSWSGR | 0.000 | 0.956 | 0.044 | 0.000 | 0.000 | 0.000 | 0.000 | 0.000 | ||
| 2 spectra, QSHSALFR | 0.000 | 0.763 | 0.000 | 0.000 | 0.000 | 0.237 | 0.000 | 0.000 | ||
| 3 spectra, INHTAFR | 0.000 | 0.975 | 0.000 | 0.000 | 0.000 | 0.025 | 0.000 | 0.000 |
| Plot | Mito | Lyso or Perox | ER | Golgi | PM | Cytosol | Nucleus | ||||||
| Expt B |
8 peptides |
15 spectra |
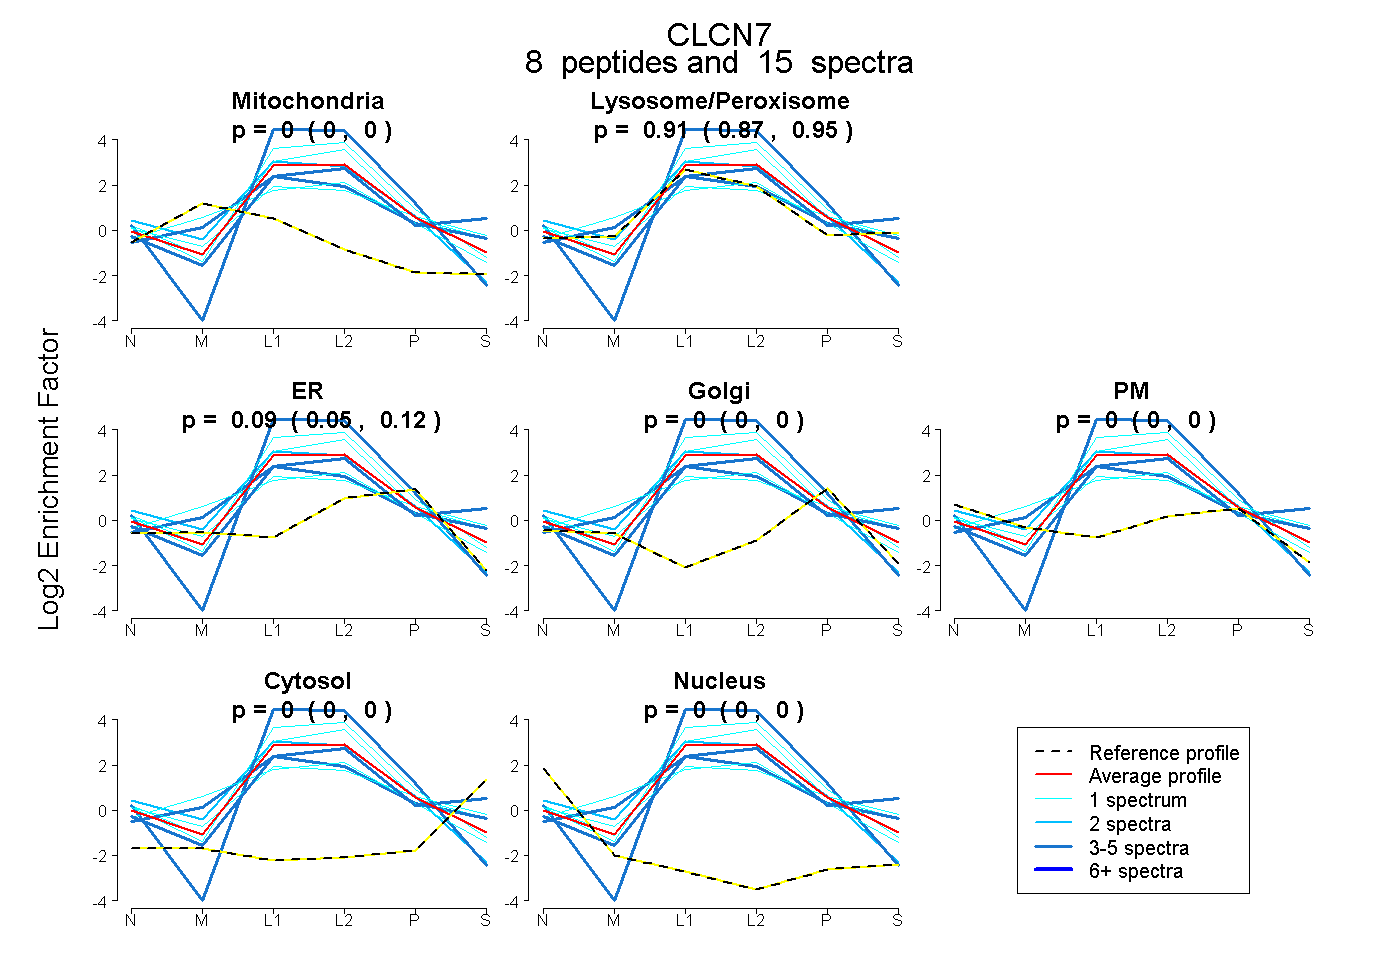 |
0.000 0.000 | 0.000 |
0.913 0.874 | 0.946 |
0.087 0.047 | 0.121 |
0.000 0.000 | 0.000 |
0.000 0.000 | 0.000 |
0.000 0.000 | 0.000 |
0.000 0.000 | 0.000 |
|||
| Plot | Lyso | Other | |||||||||||
| Expt C |
17 peptides |
145 spectra |
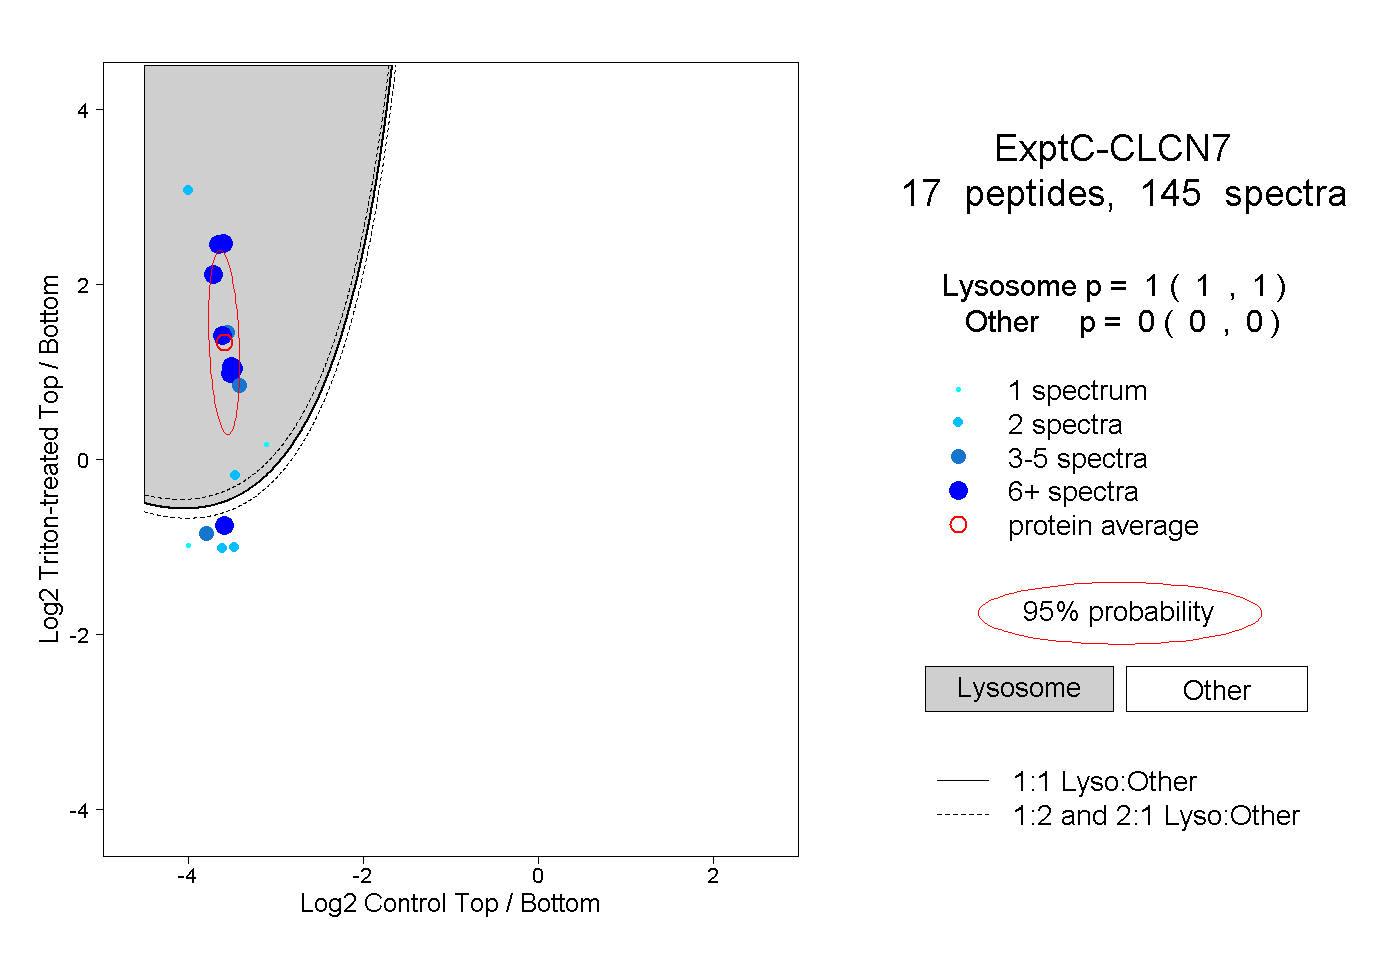 |
1.000 1.000 | 1.000 |
0.000 0.000 | 0.000 |
||||||||
| Plot | Lyso | Other | |||||||||||
| Expt D |
4 peptides |
18 spectra |
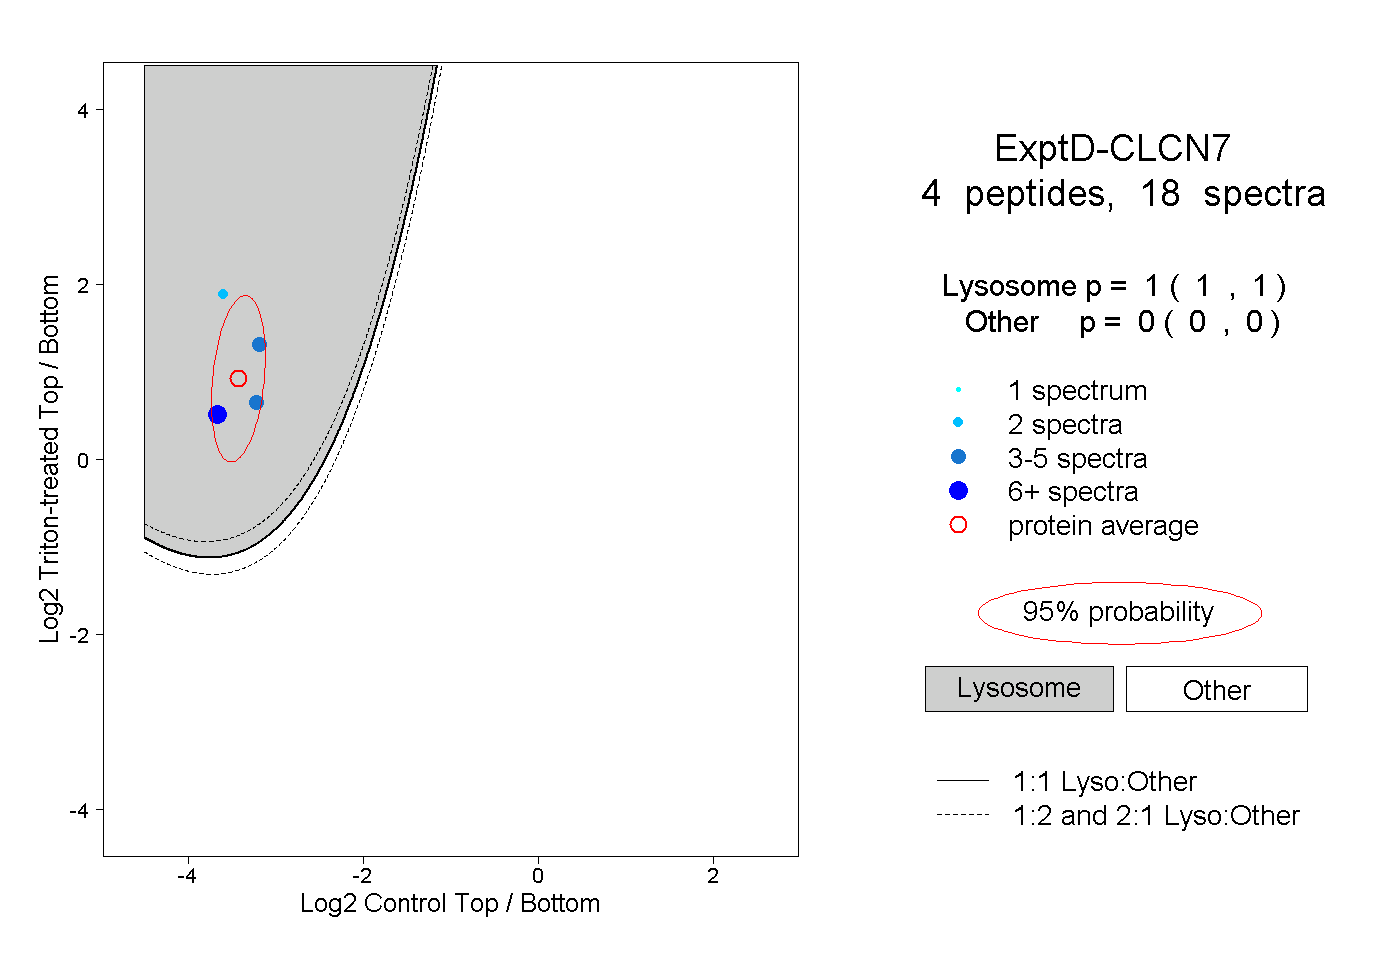 |
1.000 1.000 | 1.000 |
0.000 0.000 | 0.000 |