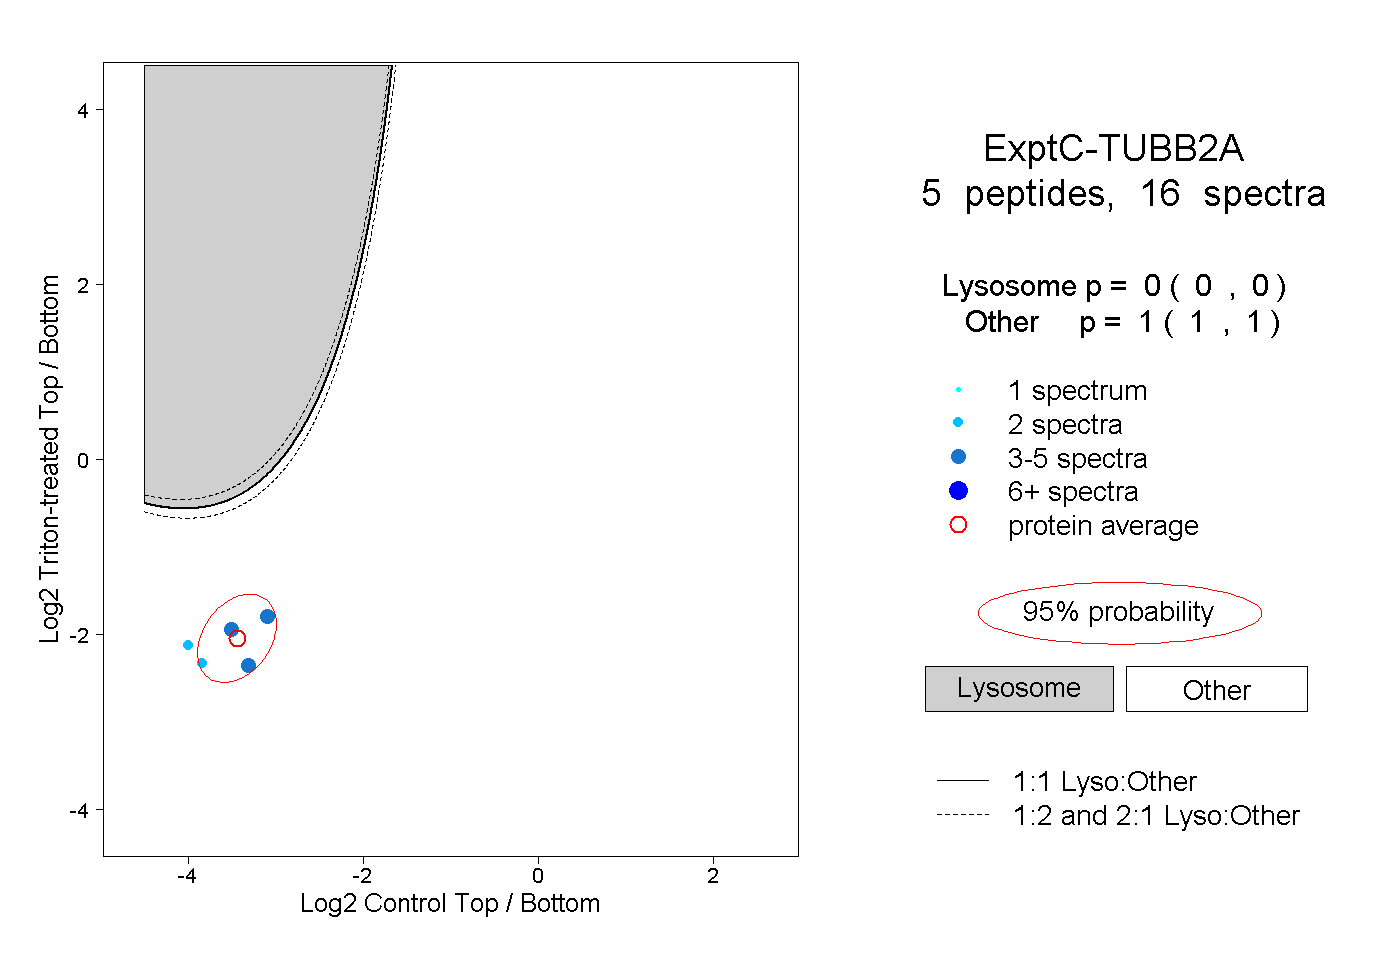
5
5peptides
spectra
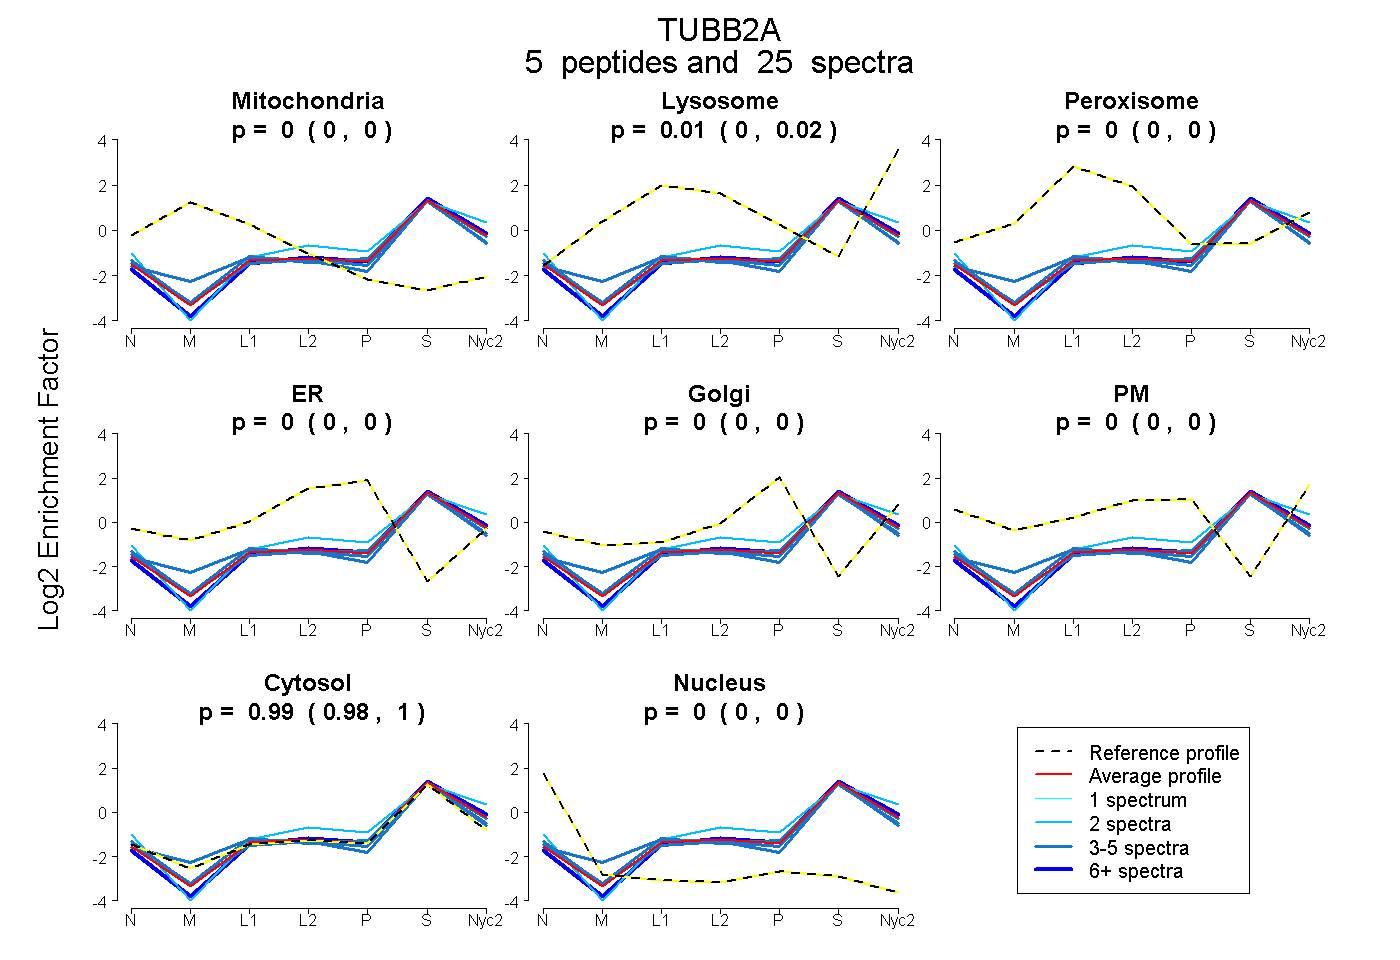
0.000 | 0.000
0.002 | 0.016
0.000 | 0.000
0.000 | 0.000
0.000 | 0.000
0.000 | 0.000
0.983 | 0.997
0.000 | 0.000
3peptides
spectra
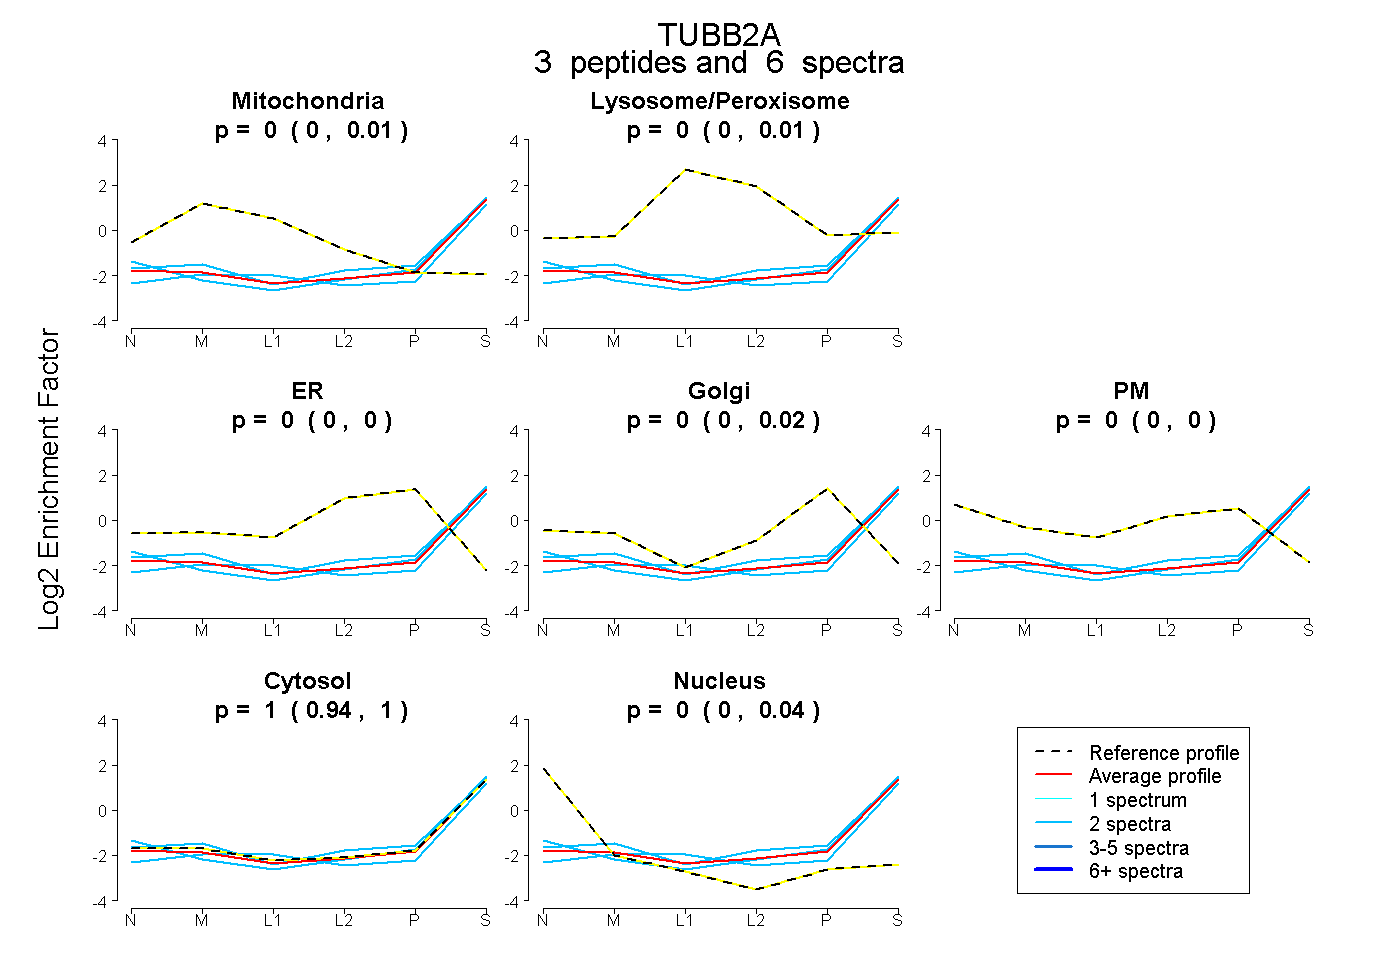
0.000 | 0.006
0.000 | 0.013
0.000 | 0.000
0.000 | 0.020
0.000 | 0.000
0.935 | 1.000
0.000 | 0.044