 2
2peptides
spectra
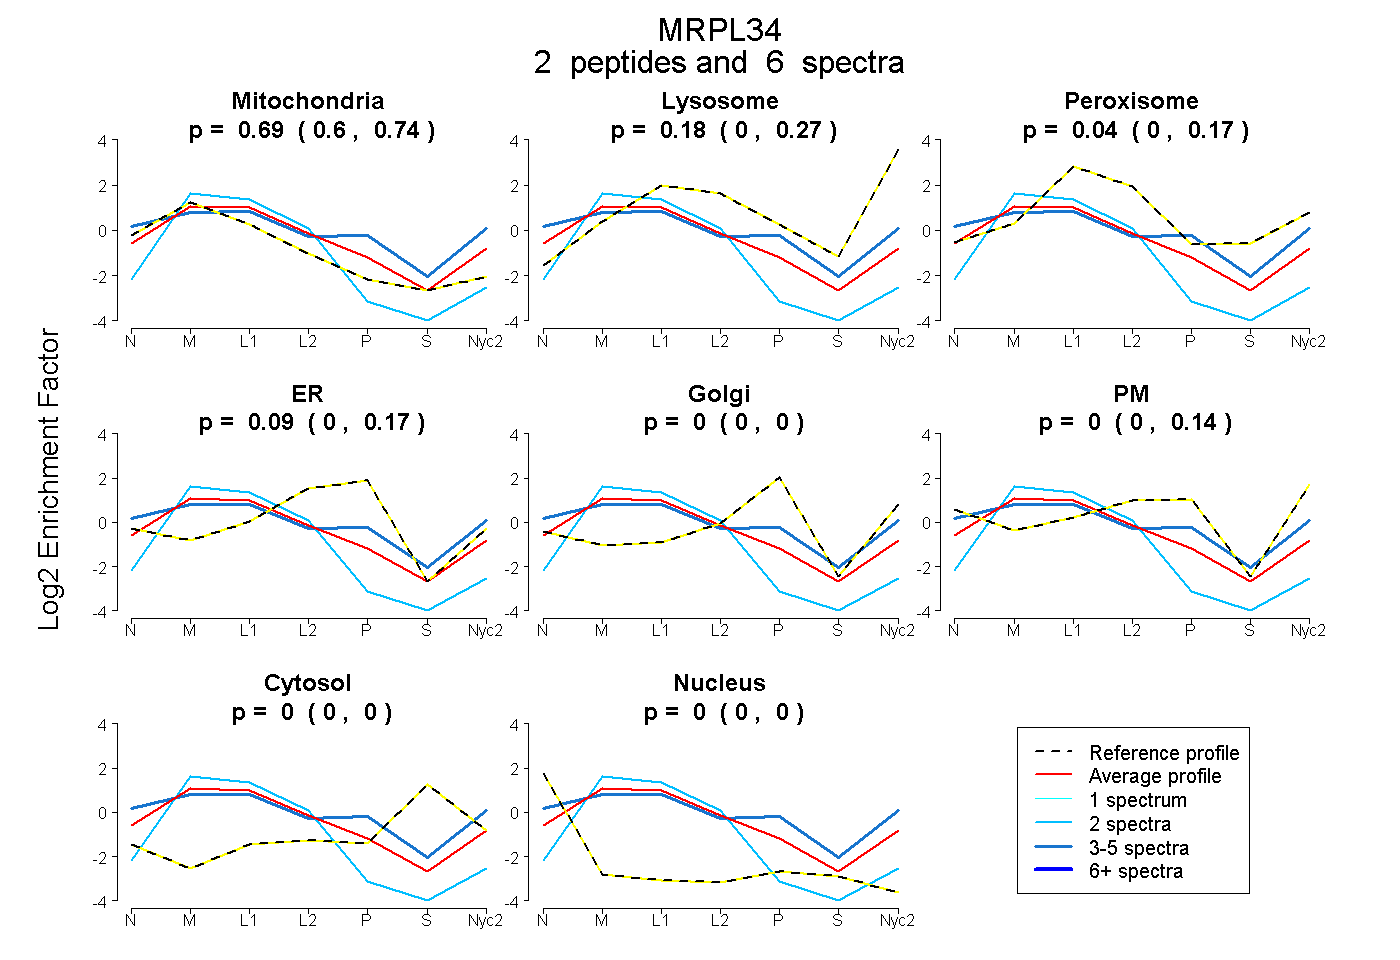
0.599 | 0.738
0.000 | 0.274
0.000 | 0.174
0.000 | 0.167
0.000 | 0.000
0.000 | 0.139
0.000 | 0.000
0.000 | 0.000
1peptide
spectrum
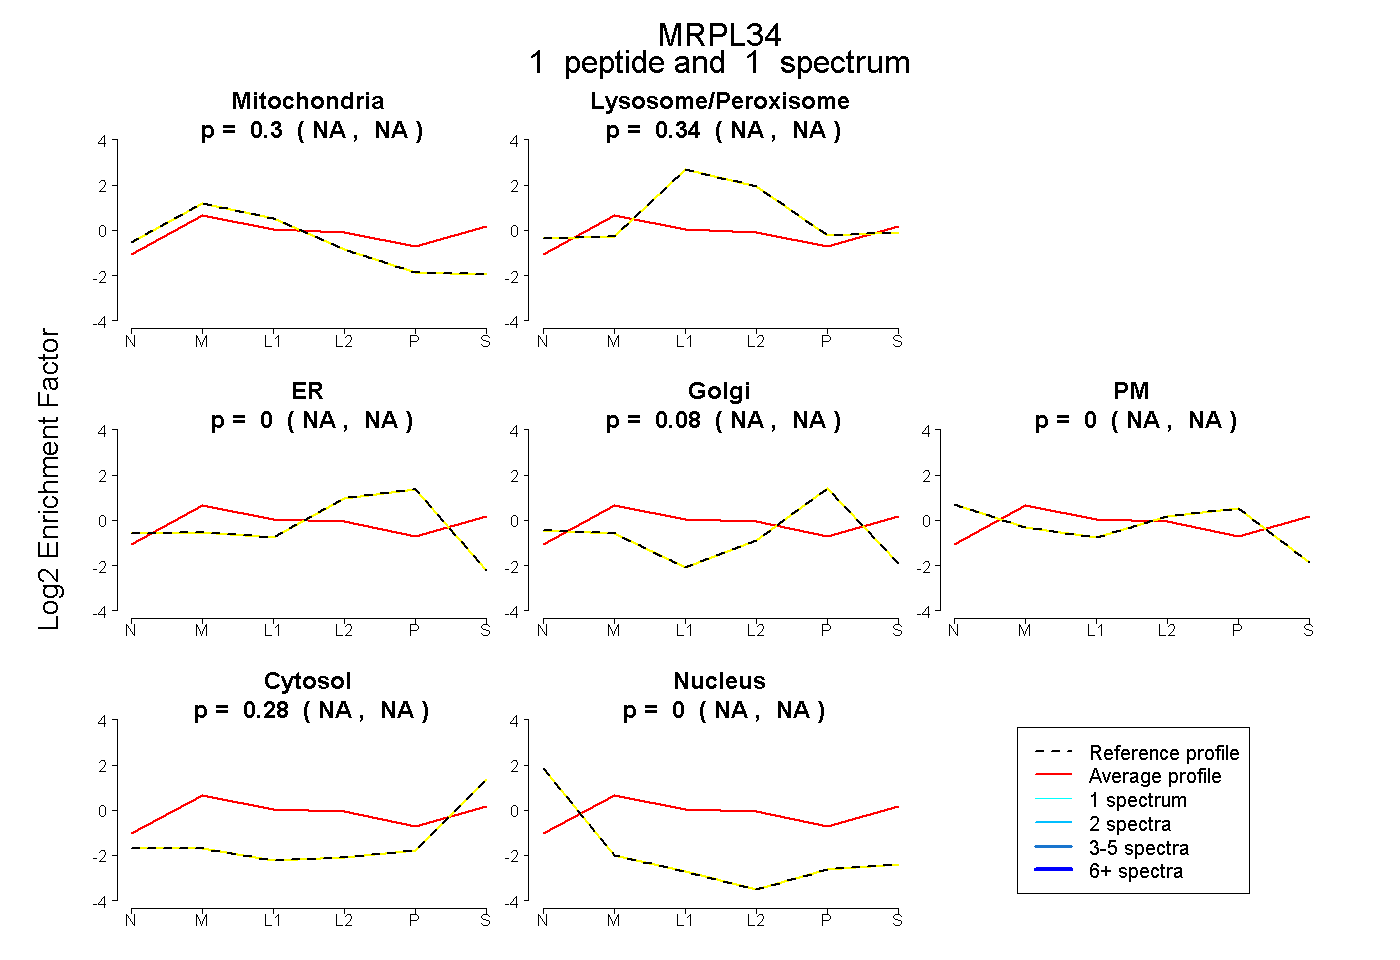
NA | NA
NA | NA
NA | NA
NA | NA
NA | NA
NA | NA
NA | NA
1peptide
spectra
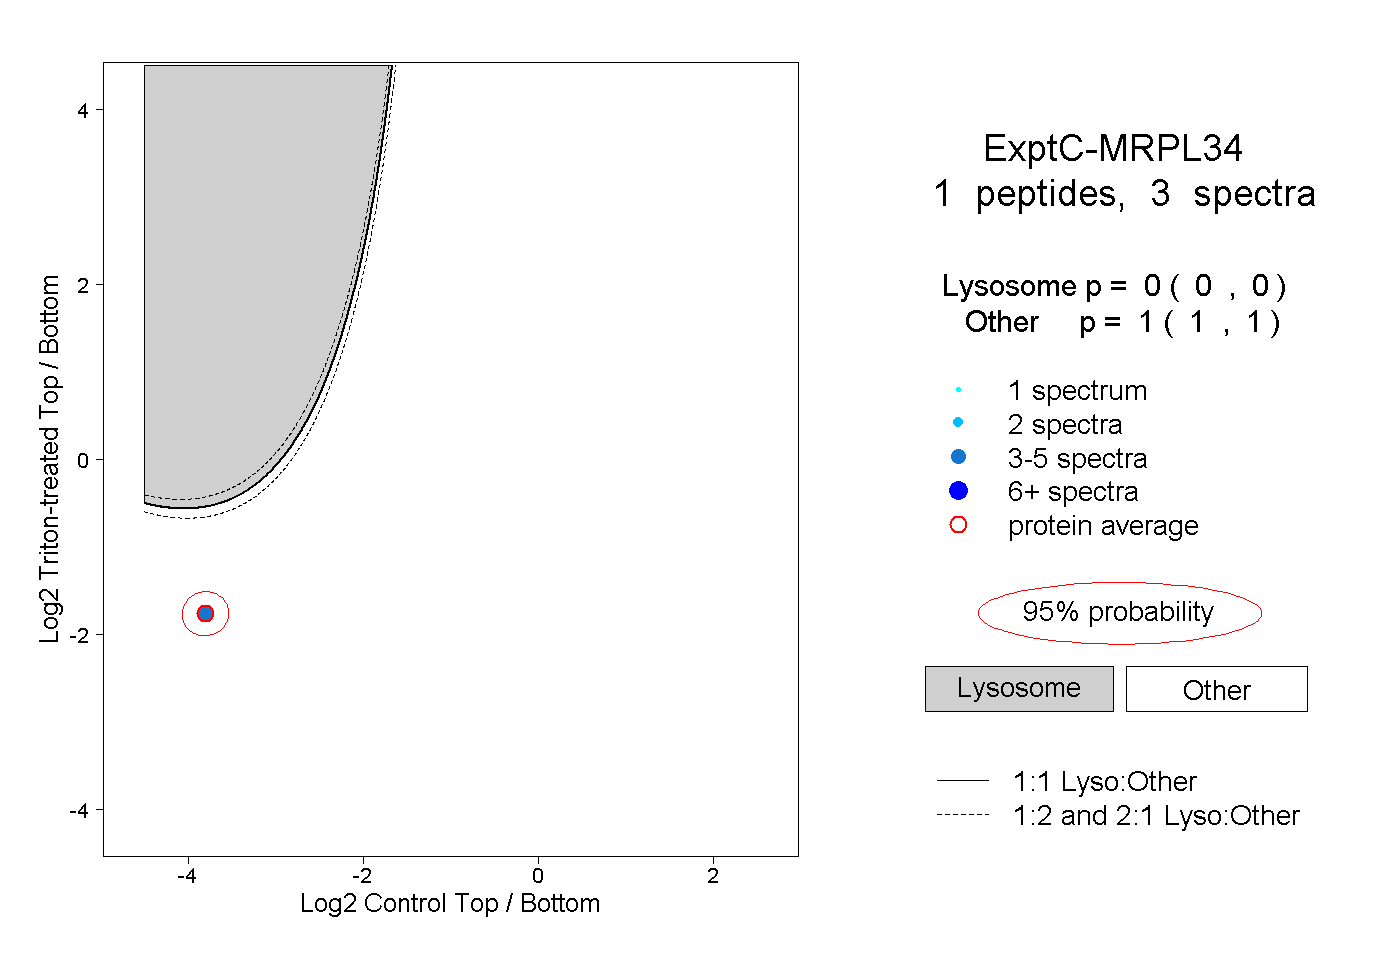
0.000 | 0.000
1.000 | 1.000