 1
1peptide
spectra
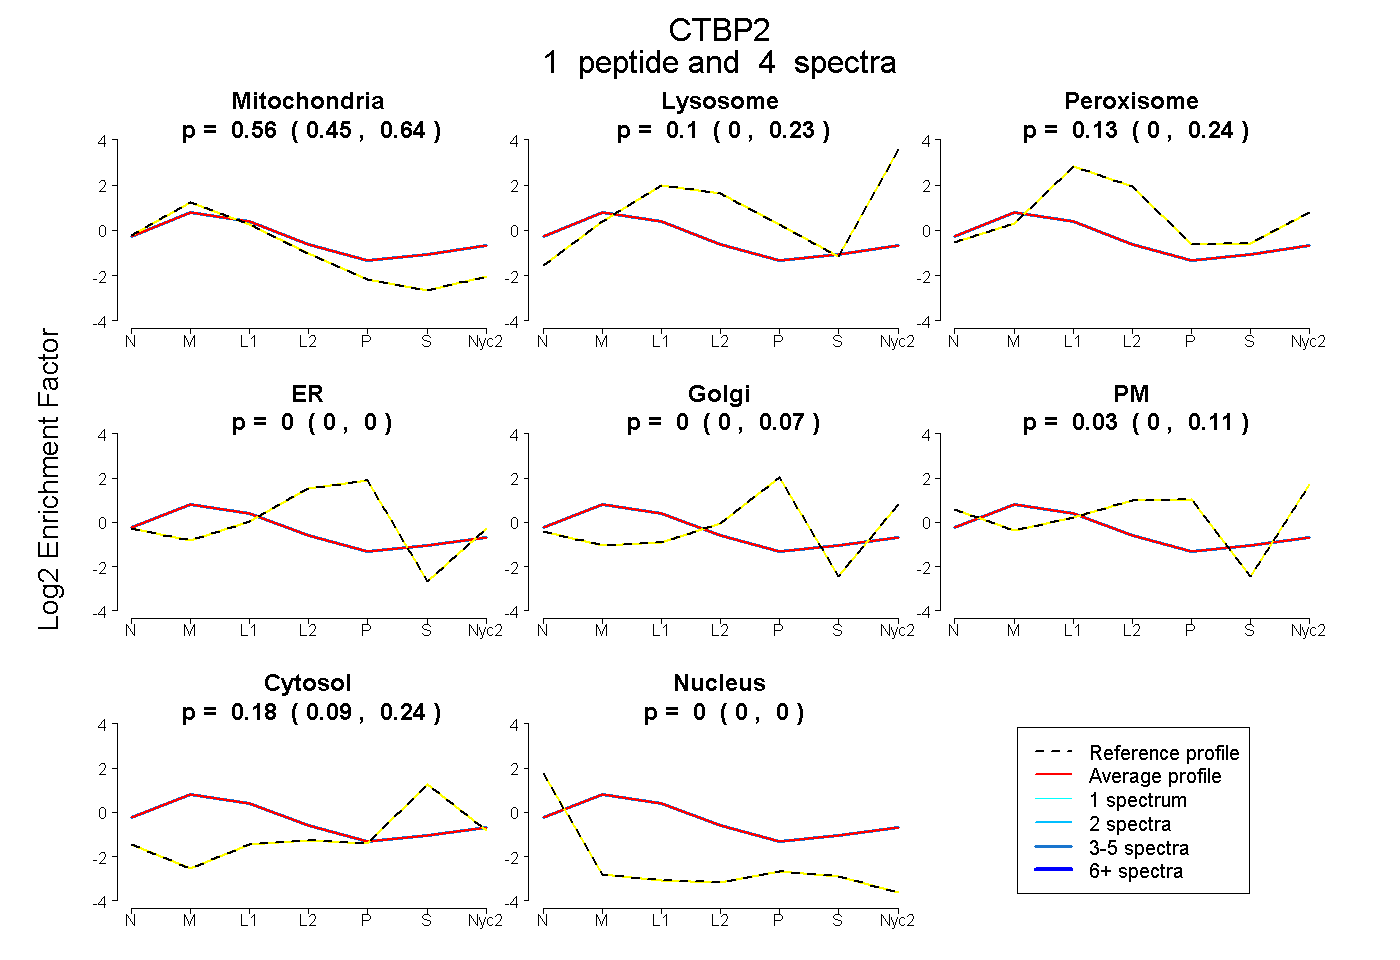
0.452 | 0.643
0.000 | 0.229
0.000 | 0.241
0.000 | 0.000
0.000 | 0.074
0.000 | 0.105
0.088 | 0.242
0.000 | 0.000
1peptide
spectrum
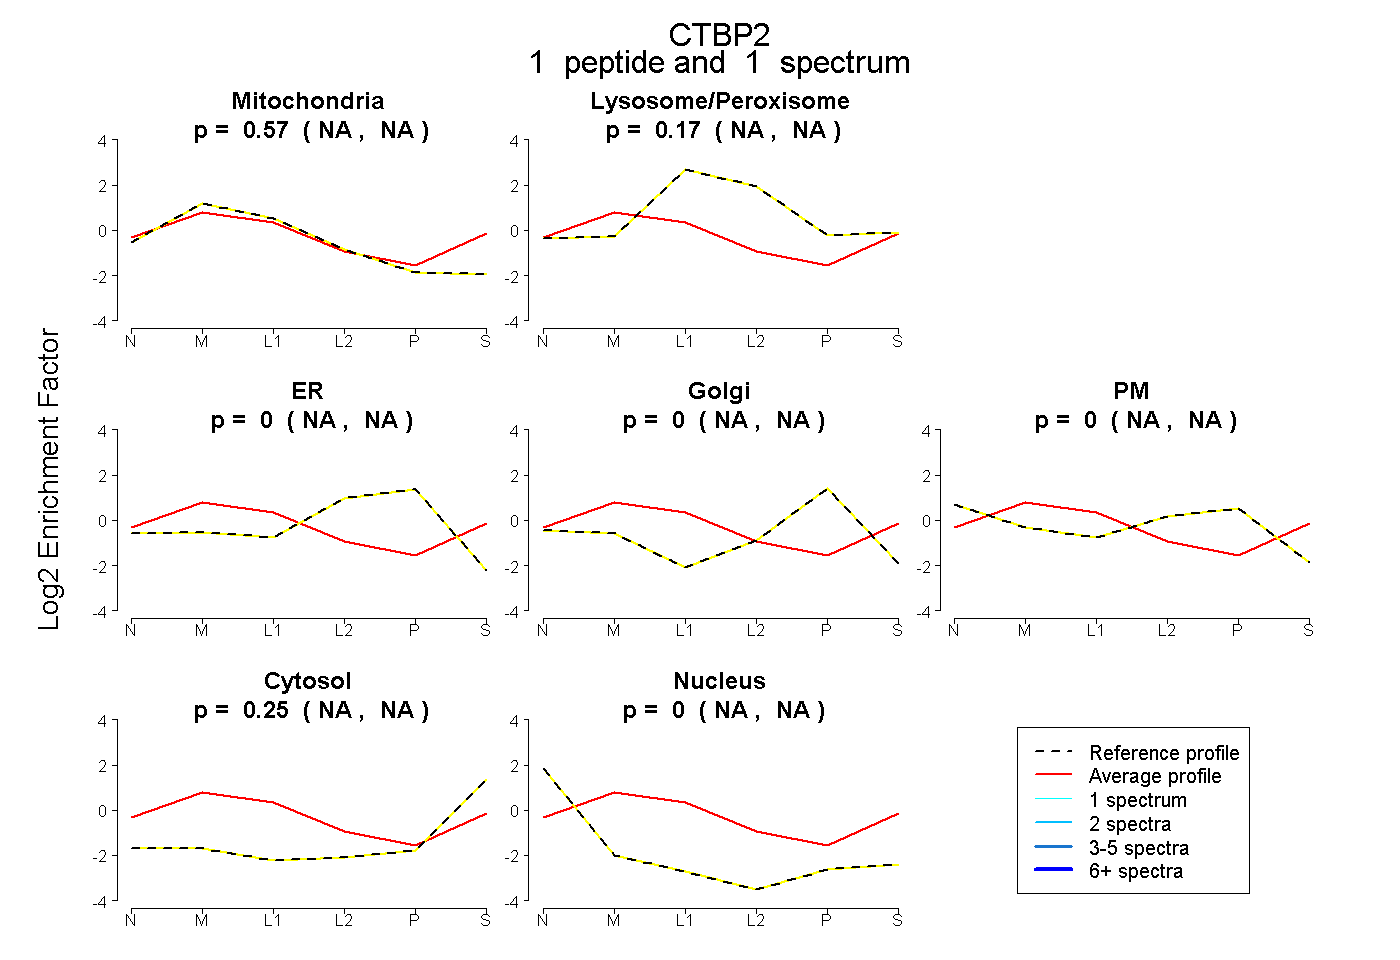
NA | NA
NA | NA
NA | NA
NA | NA
NA | NA
NA | NA
NA | NA
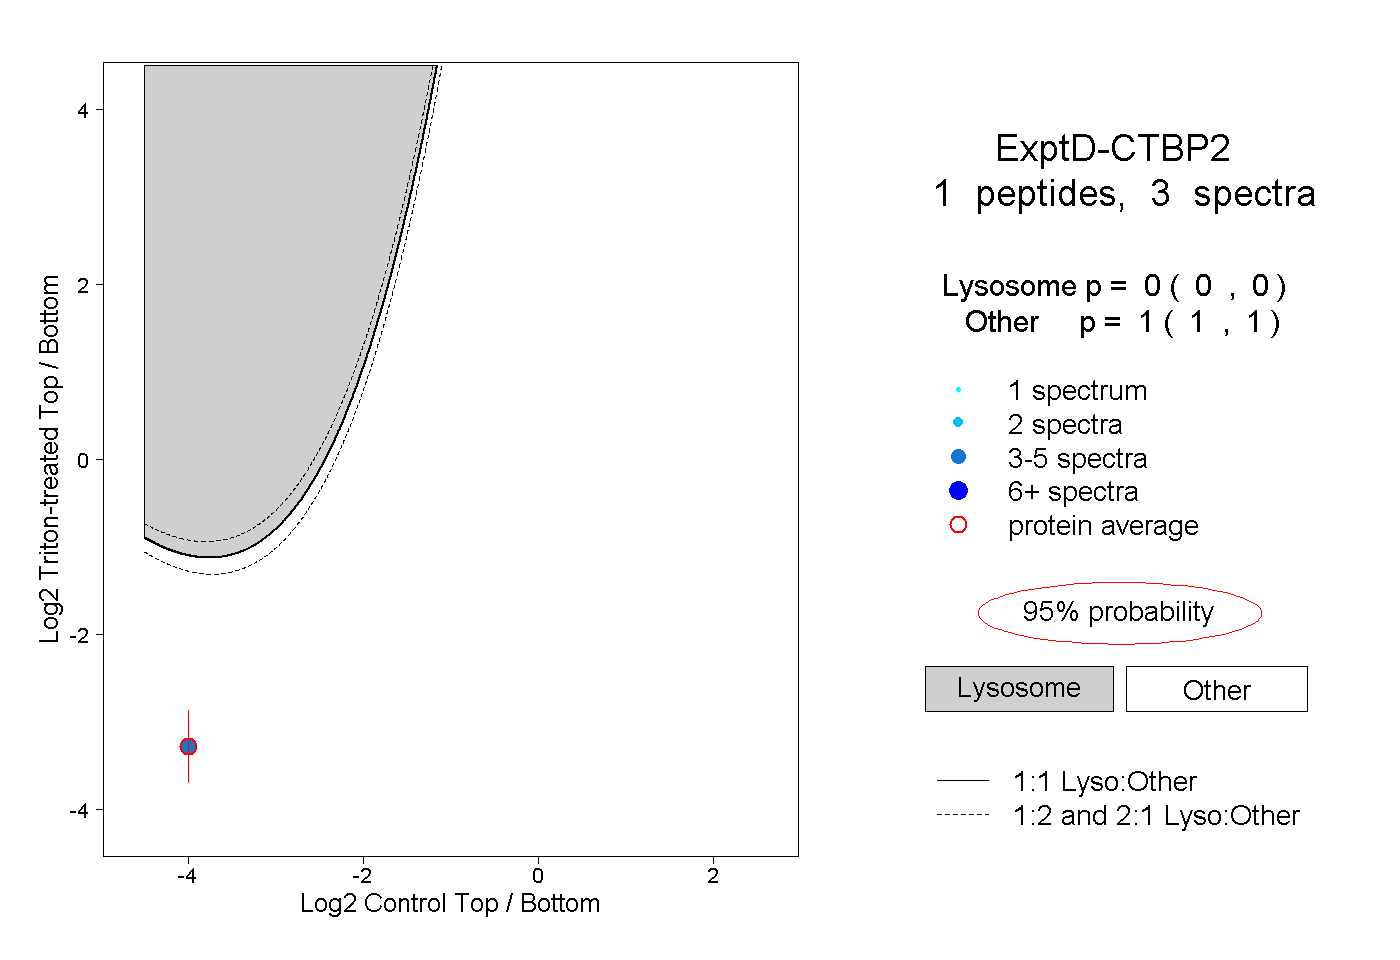
1peptide
spectra
0.000 | 0.000
1.000 | 1.000
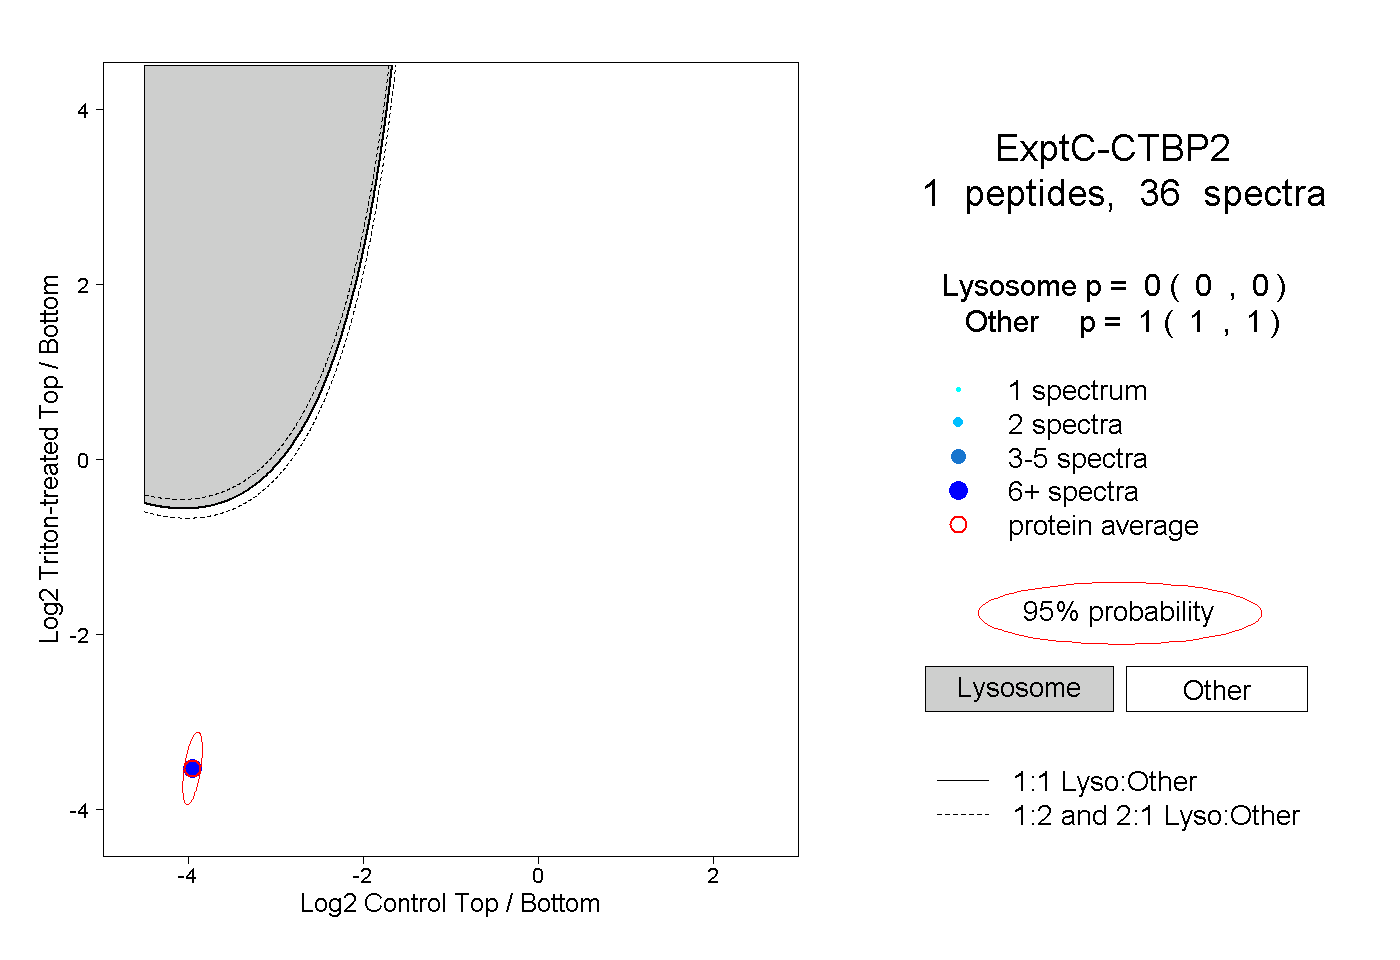
1peptide
spectra
0.000 | 0.000
1.000 | 1.000