 2
2peptides
spectra
0.000 | 0.000
0.067 | 0.160
0.000 | 0.000
0.000 | 0.000
0.775 | 0.917
0.000 | 0.000
0.000 | 0.073
0.000 | 0.000
3peptides
spectra
0.000 | 0.000
1.000 | 1.000
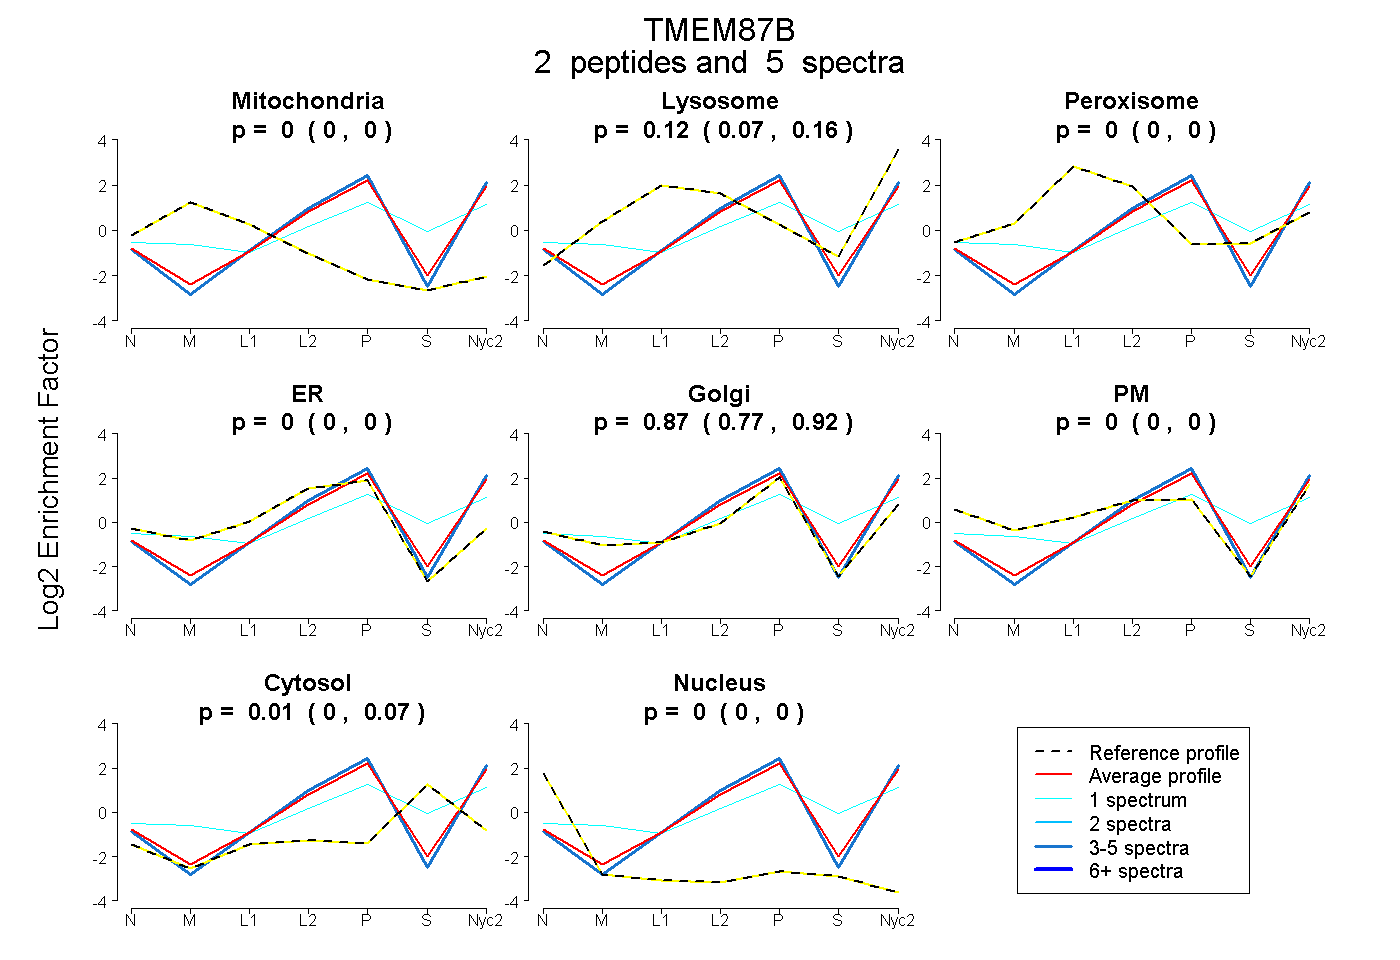
| Plot | Mito | Lyso | Perox | ER | Golgi | PM | Cytosol | Nucleus | |||||
| Expt A |
2 peptides |
5 spectra |
|
0.000 0.000 | 0.000 |
0.120 0.067 | 0.160 |
0.000 0.000 | 0.000 |
0.000 0.000 | 0.000 |
0.870 0.775 | 0.917 |
0.000 0.000 | 0.000 |
0.010 0.000 | 0.073 |
0.000 0.000 | 0.000 |
||
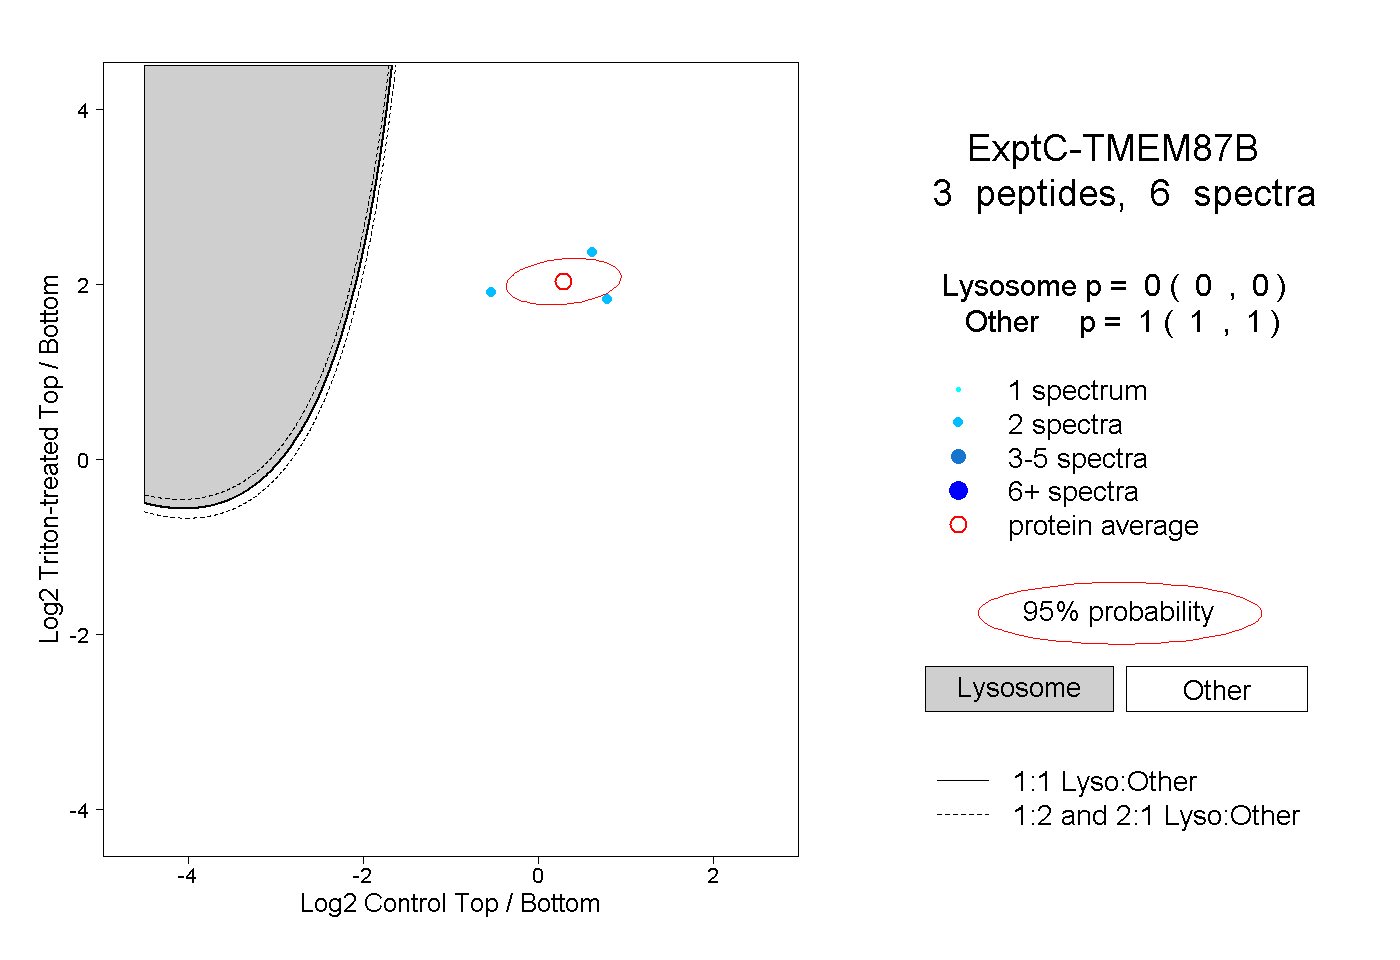
| Plot | Lyso | Other | |||||||||||
| Expt C |
3 peptides |
6 spectra |
|
0.000 0.000 | 0.000 |
1.000 1.000 | 1.000 |