14
14peptides
spectra
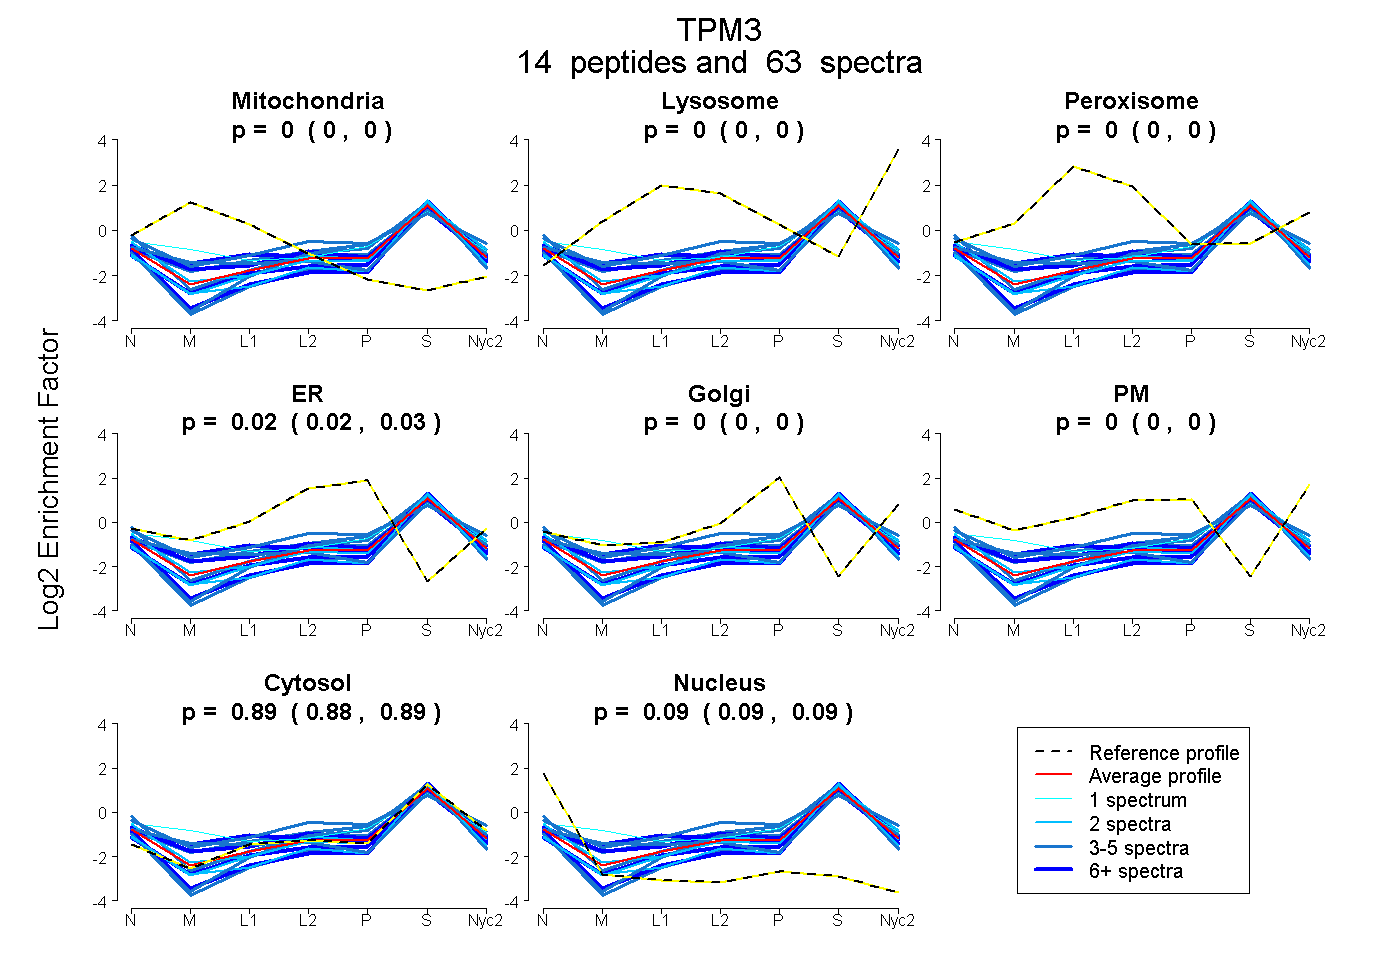
0.000 | 0.000
0.000 | 0.000
0.000 | 0.000
0.017 | 0.025
0.000 | 0.000
0.000 | 0.000
0.884 | 0.891
0.088 | 0.094
10peptides
spectra
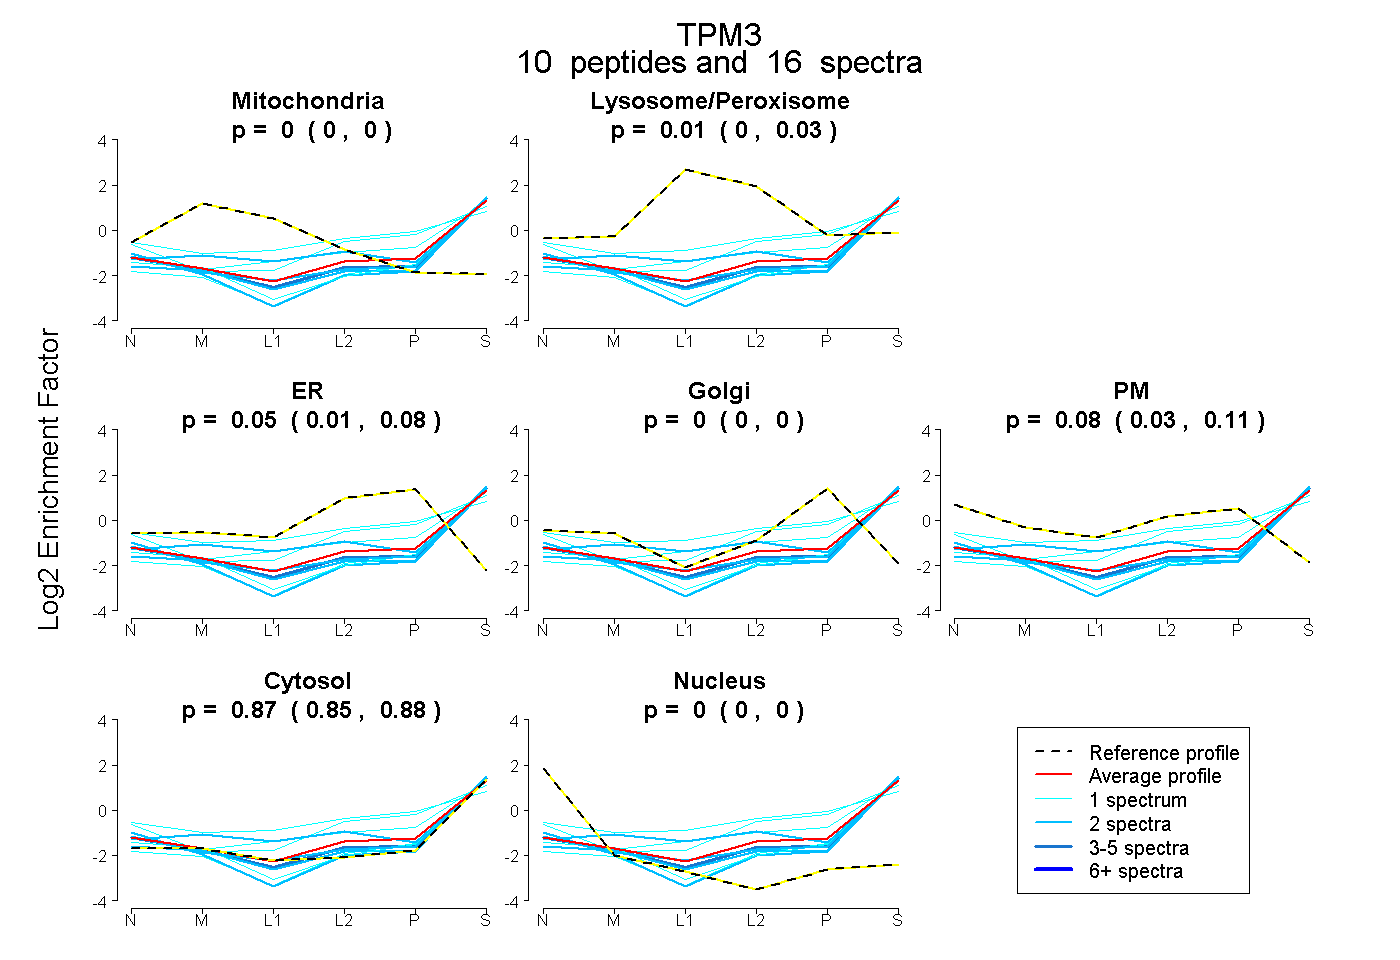
0.000 | 0.000
0.000 | 0.030
0.006 | 0.085
0.000 | 0.001
0.033 | 0.109
0.853 | 0.878
0.000 | 0.000