 14
14peptides
spectra
0.000 | 0.000
0.000 | 0.000
0.000 | 0.000
0.017 | 0.025
0.000 | 0.000
0.000 | 0.000
0.884 | 0.891
0.088 | 0.094
| Plot | Mito | Lyso | Perox | ER | Golgi | PM | Cytosol | Nucleus | |||||
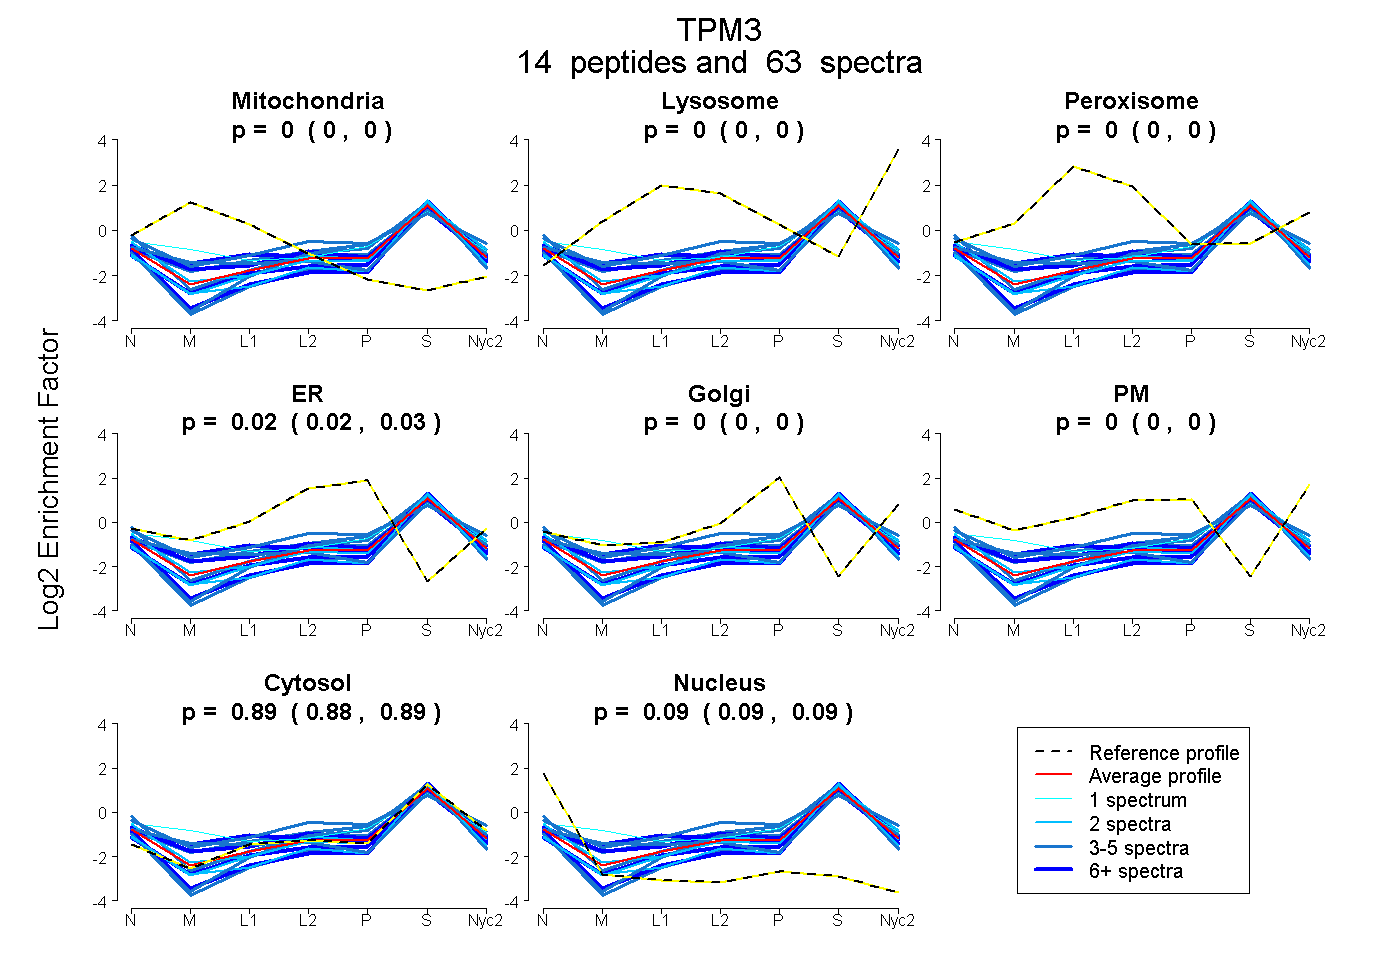
| Expt A |
14 peptides |
63 spectra |
|
0.000 0.000 | 0.000 |
0.000 0.000 | 0.000 |
0.000 0.000 | 0.000 |
0.021 0.017 | 0.025 |
0.000 0.000 | 0.000 |
0.000 0.000 | 0.000 |
0.888 0.884 | 0.891 |
0.091 0.088 | 0.094 |
| 10 spectra, HIAEEADR | 0.077 | 0.000 | 0.000 | 0.016 | 0.000 | 0.051 | 0.823 | 0.033 | ||
| 6 spectra, EMDEQIR | 0.000 | 0.000 | 0.000 | 0.000 | 0.000 | 0.000 | 0.917 | 0.083 | ||
| 5 spectra, CLSAAEEK | 0.018 | 0.000 | 0.000 | 0.106 | 0.023 | 0.025 | 0.827 | 0.000 | ||
| 2 spectra, IQVLQQQADDAEER | 0.000 | 0.000 | 0.000 | 0.000 | 0.000 | 0.000 | 0.887 | 0.113 | ||
| 2 spectra, LATALQK | 0.000 | 0.000 | 0.000 | 0.000 | 0.000 | 0.055 | 0.862 | 0.083 | ||
| 3 spectra, YEEVAR | 0.000 | 0.000 | 0.046 | 0.061 | 0.000 | 0.162 | 0.709 | 0.022 | ||
| 4 spectra, EEHLCTQR | 0.000 | 0.000 | 0.000 | 0.043 | 0.000 | 0.019 | 0.815 | 0.123 | ||
| 8 spectra, EQAEAEVASLNR | 0.183 | 0.000 | 0.030 | 0.000 | 0.000 | 0.000 | 0.787 | 0.000 | ||
| 3 spectra, LVIIEGDLER | 0.183 | 0.000 | 0.000 | 0.000 | 0.000 | 0.000 | 0.795 | 0.022 | ||
| 4 spectra, AELAESR | 0.000 | 0.000 | 0.000 | 0.000 | 0.000 | 0.000 | 0.844 | 0.156 | ||
| 9 spectra, IQLVEEELDR | 0.000 | 0.000 | 0.000 | 0.000 | 0.000 | 0.000 | 0.843 | 0.157 | ||
| 2 spectra, YEEEIK | 0.000 | 0.000 | 0.000 | 0.000 | 0.000 | 0.000 | 0.906 | 0.094 | ||
| 1 spectrum, TIDDLEDK | 0.183 | 0.000 | 0.000 | 0.000 | 0.068 | 0.050 | 0.699 | 0.000 | ||
| 4 spectra, MEIQEIQLK | 0.000 | 0.000 | 0.000 | 0.000 | 0.000 | 0.000 | 0.912 | 0.088 |
| Plot | Mito | Lyso or Perox | ER | Golgi | PM | Cytosol | Nucleus | ||||||
| Expt B |
10 peptides |
16 spectra |
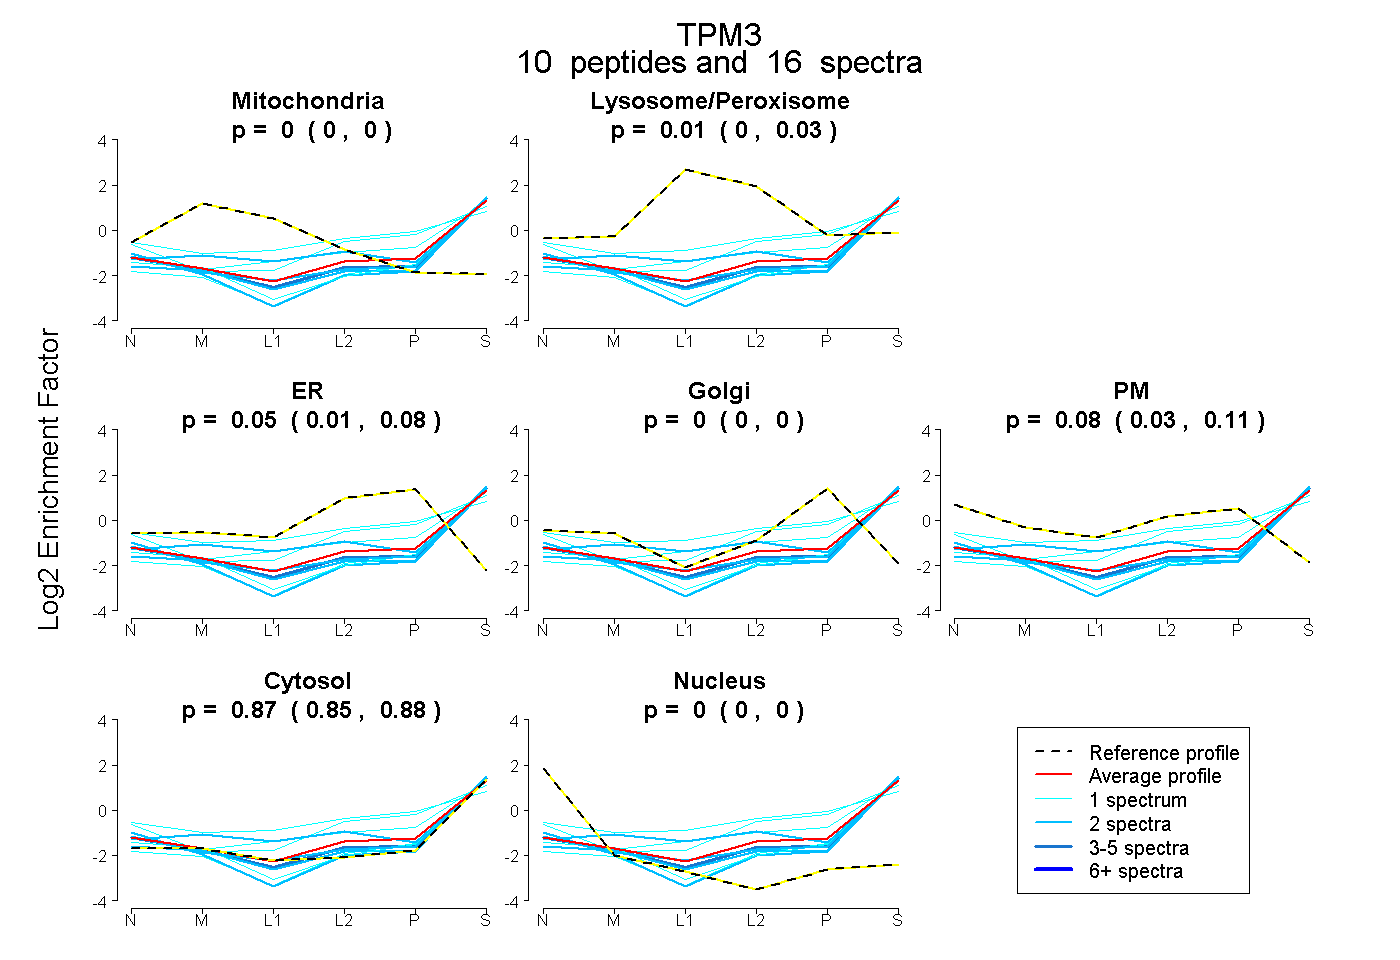 |
0.000 0.000 | 0.000 |
0.006 0.000 | 0.030 |
0.051 0.006 | 0.085 |
0.000 0.000 | 0.001 |
0.076 0.033 | 0.109 |
0.868 0.853 | 0.878 |
0.000 0.000 | 0.000 |
|||
| Plot | Lyso | Other | |||||||||||
| Expt C |
16 peptides |
85 spectra |
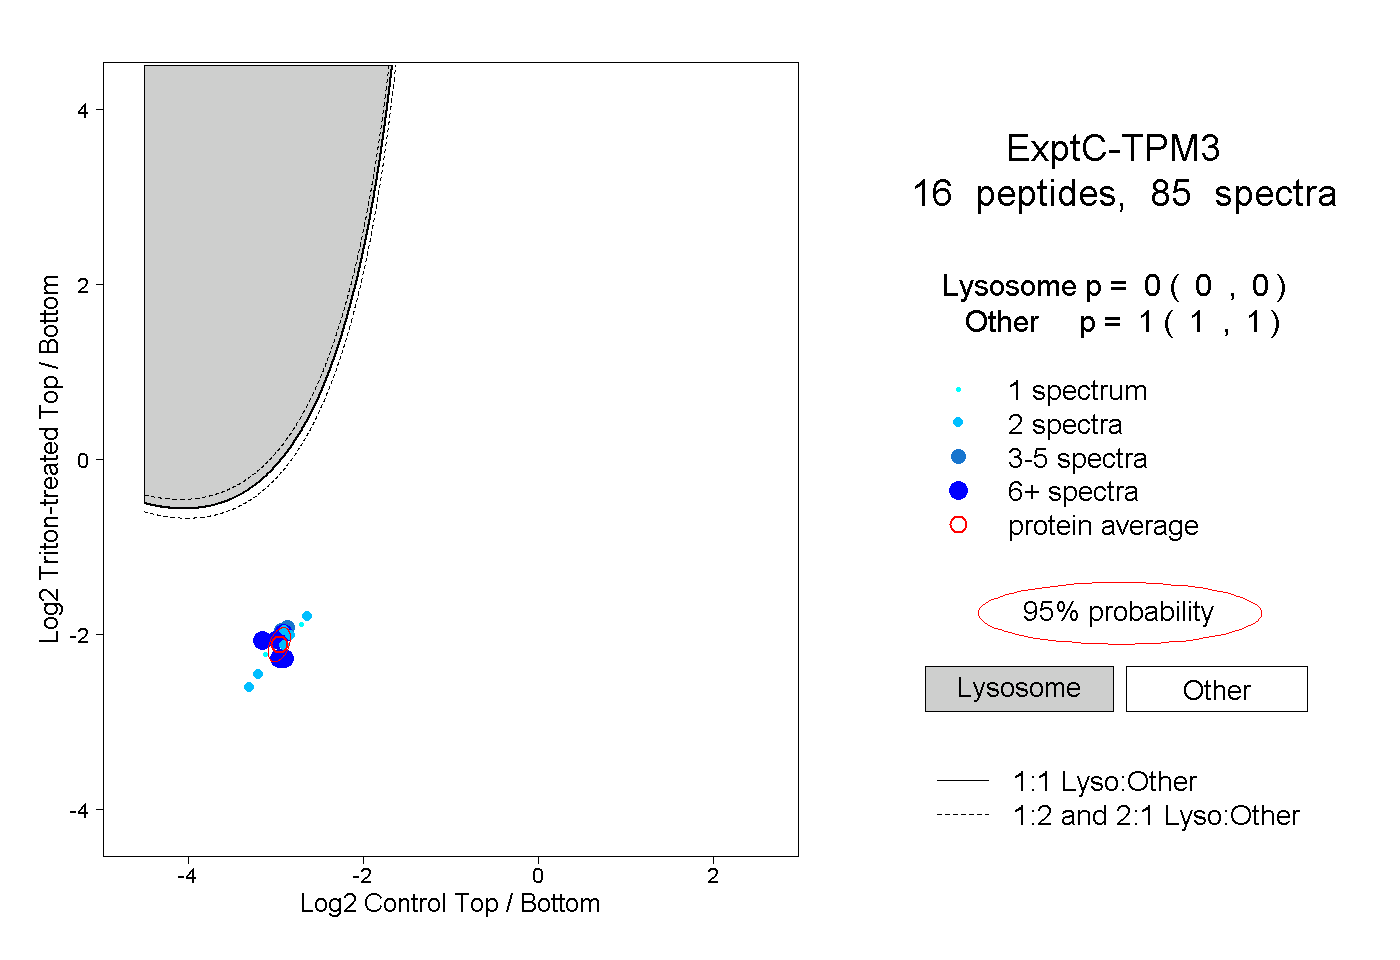 |
0.000 0.000 | 0.000 |
1.000 1.000 | 1.000 |
||||||||
| Plot | Lyso | Other | |||||||||||
| Expt D |
5 peptides |
9 spectra |
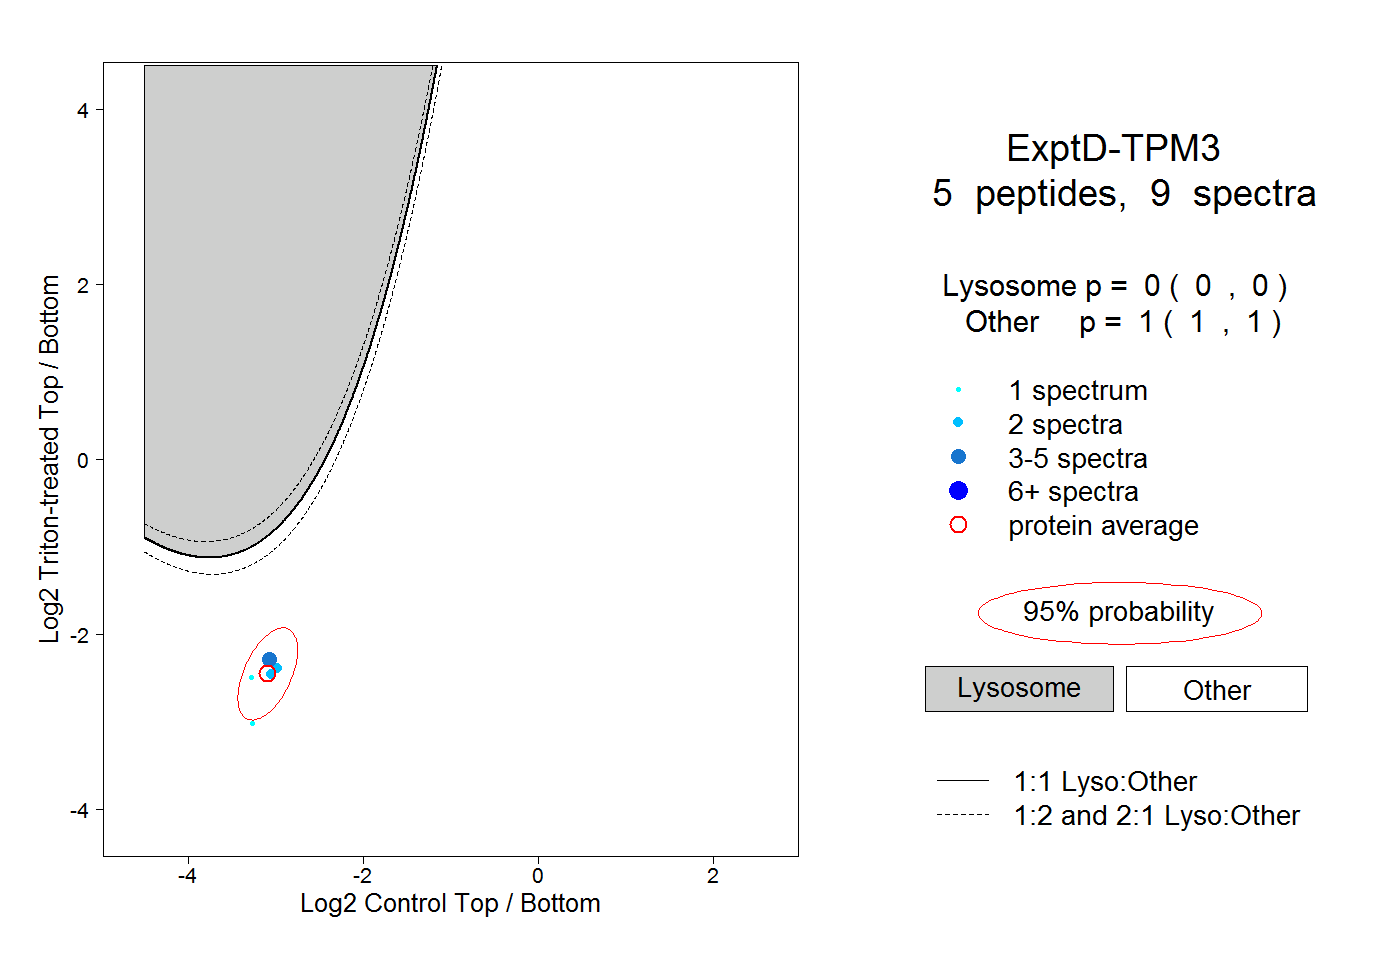 |
0.000 0.000 | 0.000 |
1.000 1.000 | 1.000 |