 5
5peptides
spectra
0.000 | 0.000
0.000 | 0.063
0.001 | 0.126
0.000 | 0.000
0.000 | 0.000
0.334 | 0.401
0.514 | 0.560
0.000 | 0.000
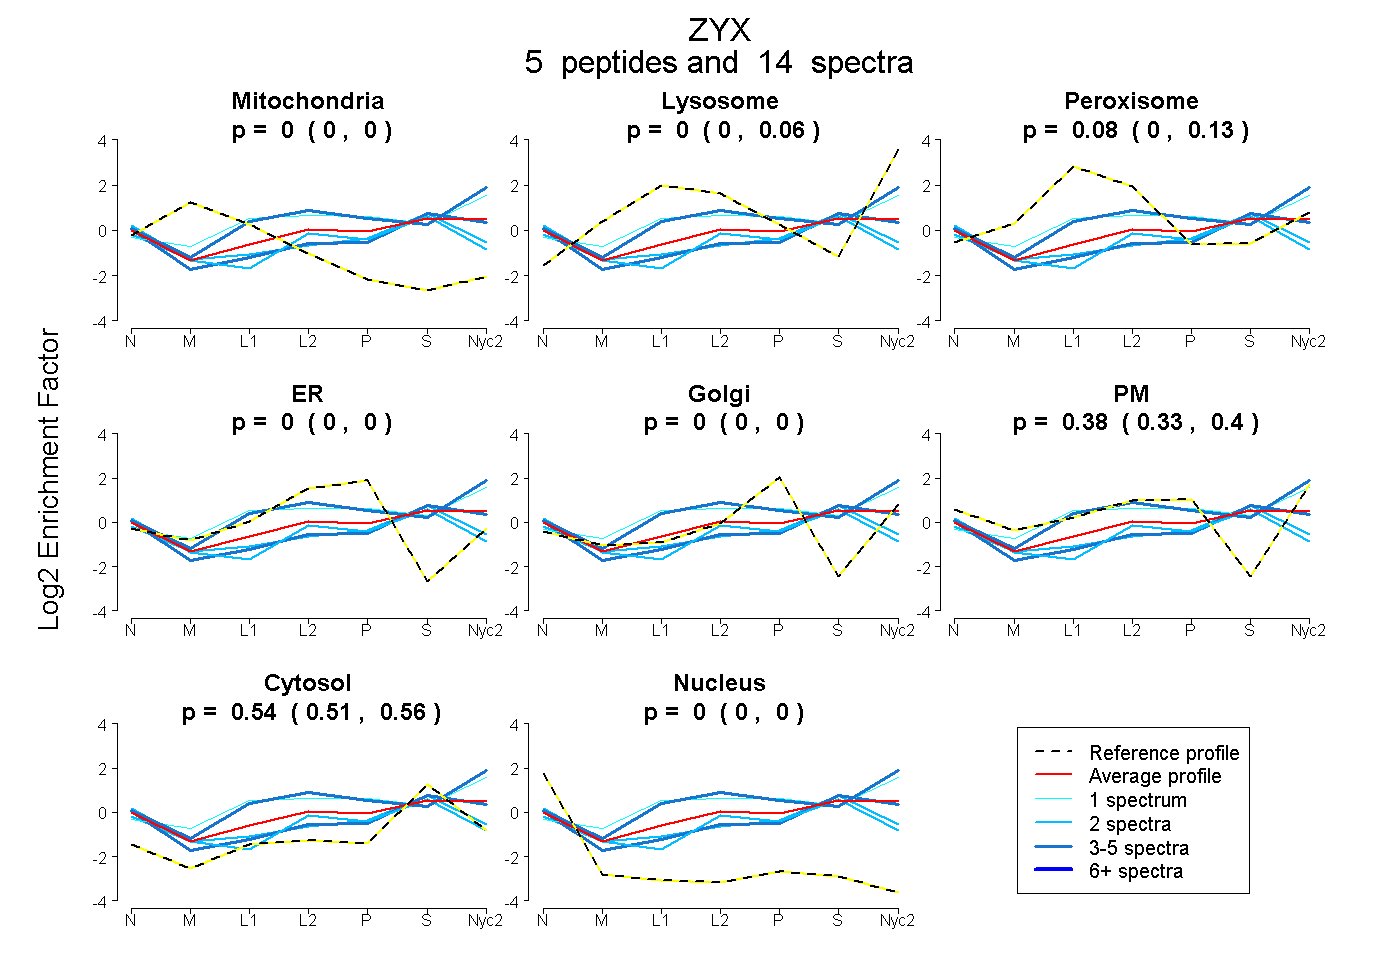
| Plot | Mito | Lyso | Perox | ER | Golgi | PM | Cytosol | Nucleus | |||||
| Expt A |
5 peptides |
14 spectra |
|
0.000 0.000 | 0.000 |
0.000 0.000 | 0.063 |
0.084 0.001 | 0.126 |
0.000 0.000 | 0.000 |
0.000 0.000 | 0.000 |
0.378 0.334 | 0.401 |
0.537 0.514 | 0.560 |
0.000 0.000 | 0.000 |
| 4 spectra, VNPFRPGDSESPVAAGAQR | 0.000 | 0.315 | 0.036 | 0.000 | 0.000 | 0.343 | 0.306 | 0.000 | ||
| 1 spectrum, GPLSQAPTPAPK | 0.000 | 0.318 | 0.101 | 0.000 | 0.000 | 0.263 | 0.317 | 0.000 | ||
| 5 spectra, AQPAVR | 0.000 | 0.000 | 0.000 | 0.000 | 0.000 | 0.320 | 0.680 | 0.000 | ||
| 2 spectra, CNTCGQPITDR | 0.000 | 0.000 | 0.000 | 0.134 | 0.000 | 0.173 | 0.620 | 0.073 | ||
| 2 spectra, ALSIEADDNGCFPLDGHVLCR | 0.040 | 0.000 | 0.007 | 0.017 | 0.000 | 0.243 | 0.692 | 0.000 |
| Plot | Mito | Lyso or Perox | ER | Golgi | PM | Cytosol | Nucleus | ||||||
| Expt B |
1 peptide |
1 spectrum |
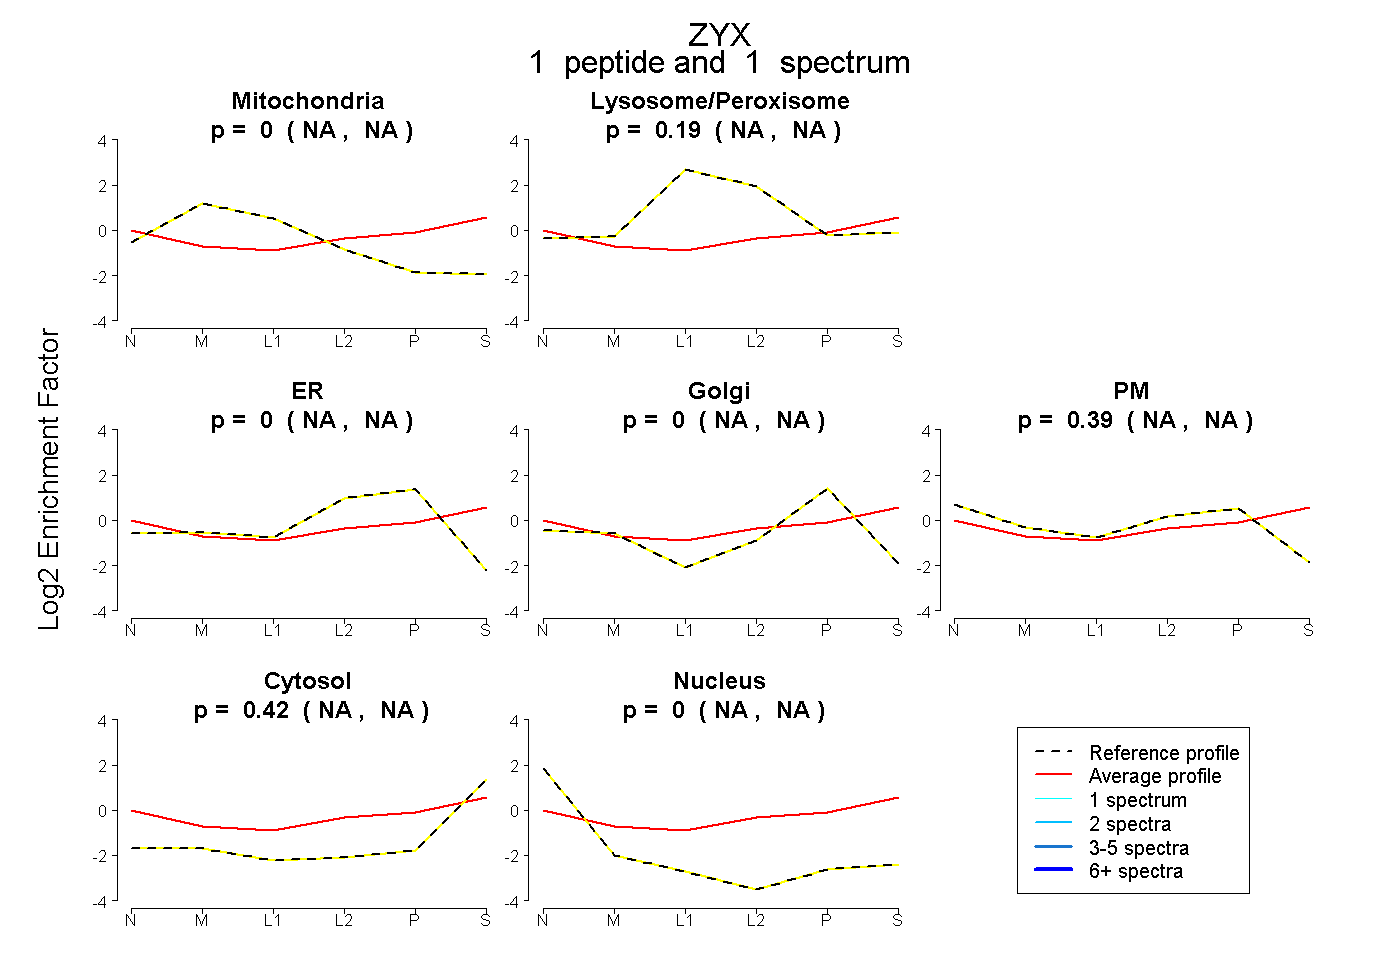 |
0.000 NA | NA |
0.190 NA | NA |
0.000 NA | NA |
0.000 NA | NA |
0.394 NA | NA |
0.416 NA | NA |
0.000 NA | NA |
|||
| Plot | Lyso | Other | |||||||||||
| Expt C |
11 peptides |
38 spectra |
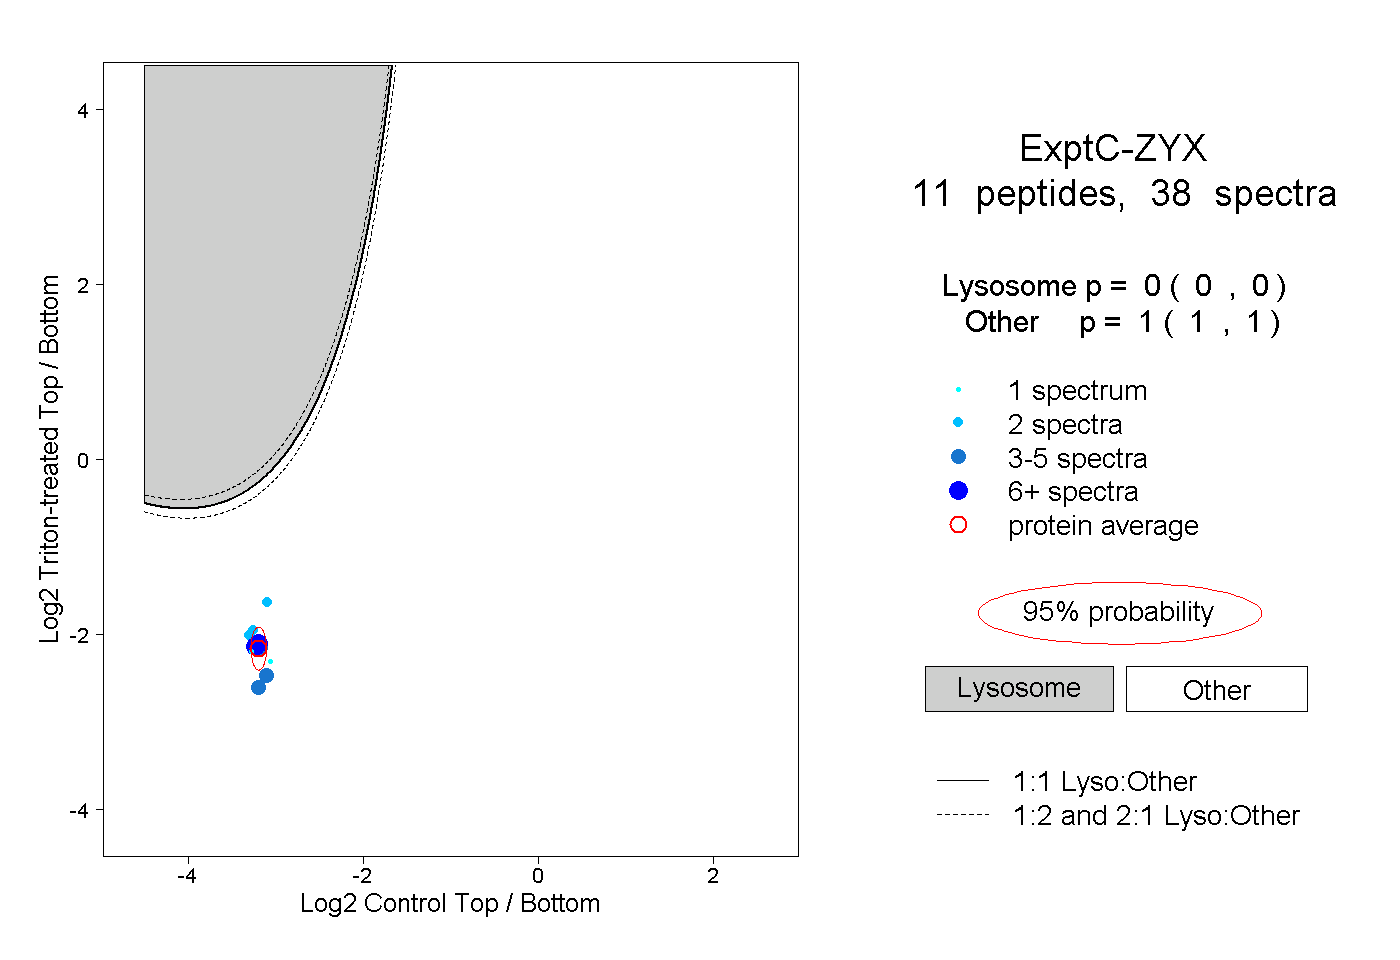 |
0.000 0.000 | 0.000 |
1.000 1.000 | 1.000 |
||||||||
| Plot | Lyso | Other | |||||||||||
| Expt D |
2 peptides |
2 spectra |
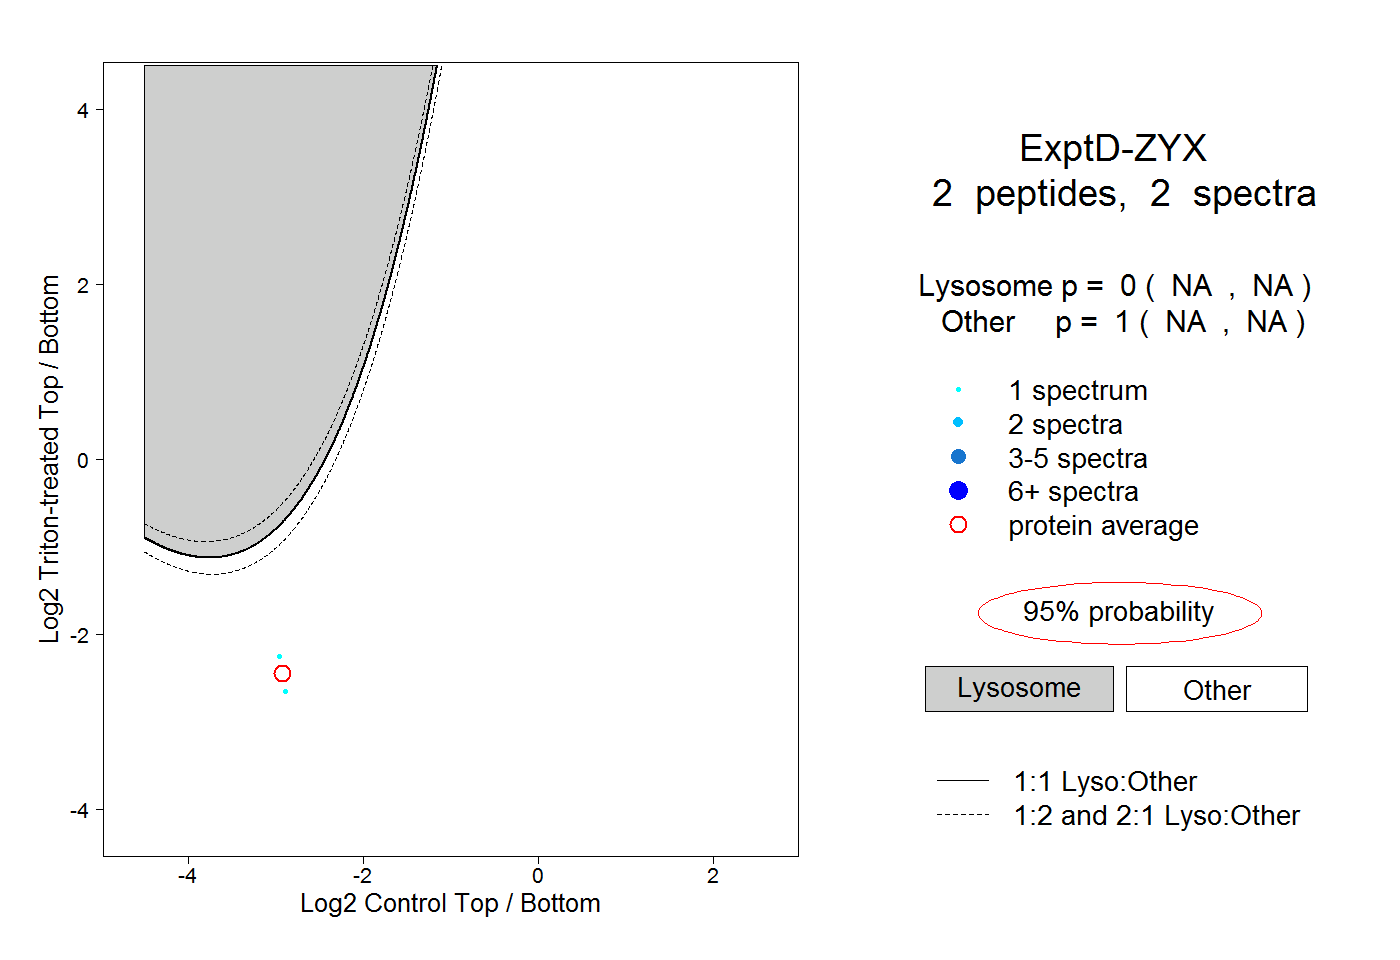 |
0.000 NA | NA |
1.000 NA | NA |