 3
3peptides
spectra
0.000 | 0.000
0.040 | 0.085
0.000 | 0.000
0.000 | 0.041
0.096 | 0.176
0.000 | 0.018
0.759 | 0.794
0.000 | 0.000
3peptides
spectra
0.000 | 0.000
1.000 | 1.000
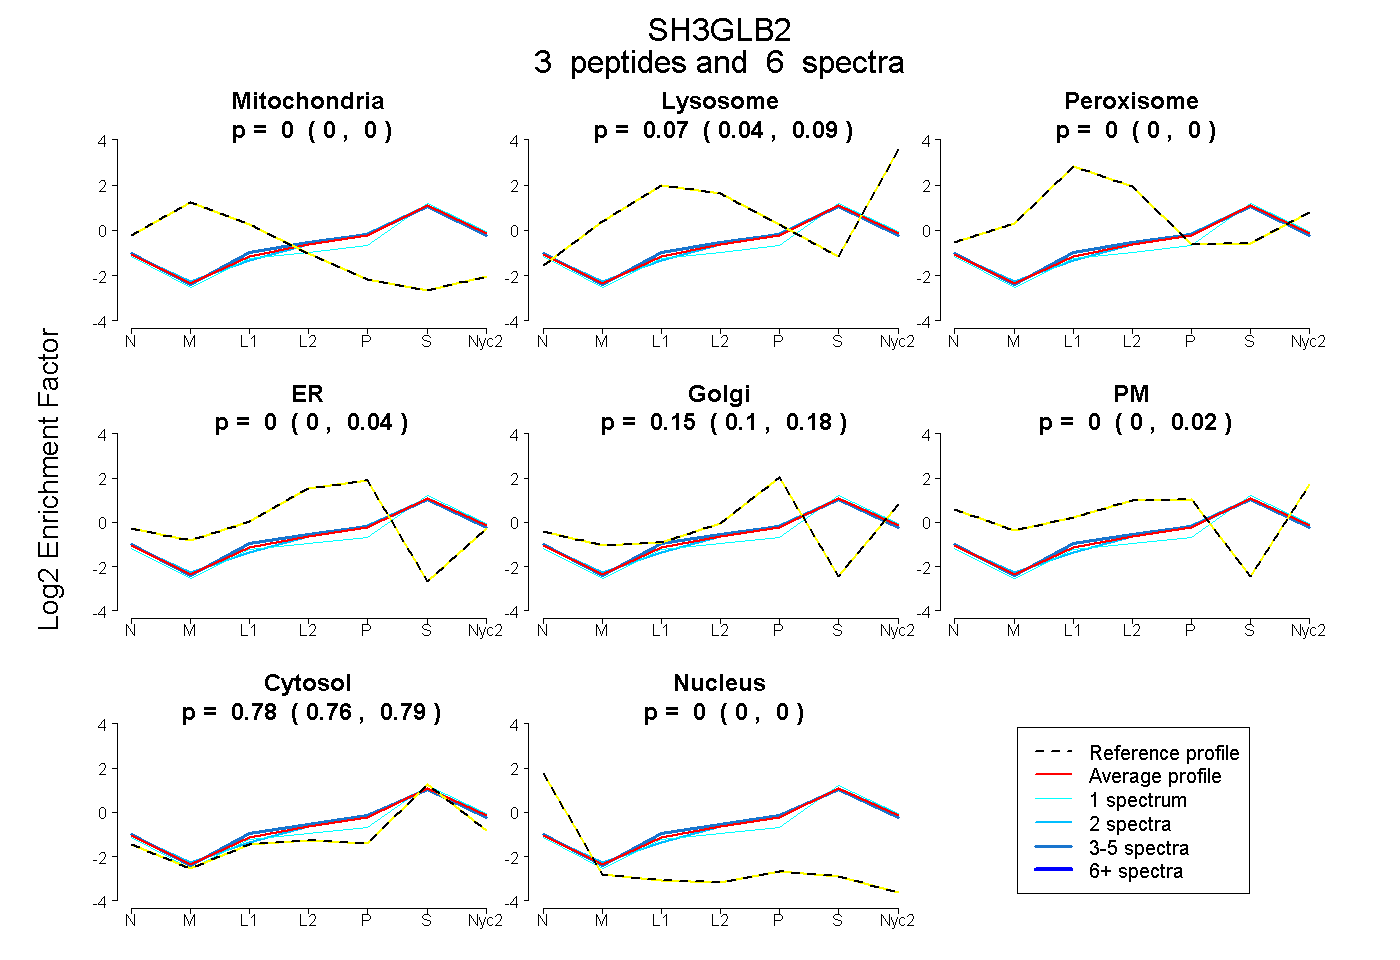
| Plot | Mito | Lyso | Perox | ER | Golgi | PM | Cytosol | Nucleus | |||||
| Expt A |
3 peptides |
6 spectra |
|
0.000 0.000 | 0.000 |
0.066 0.040 | 0.085 |
0.000 0.000 | 0.000 |
0.003 0.000 | 0.041 |
0.153 0.096 | 0.176 |
0.000 0.000 | 0.018 |
0.778 0.759 | 0.794 |
0.000 0.000 | 0.000 |
||
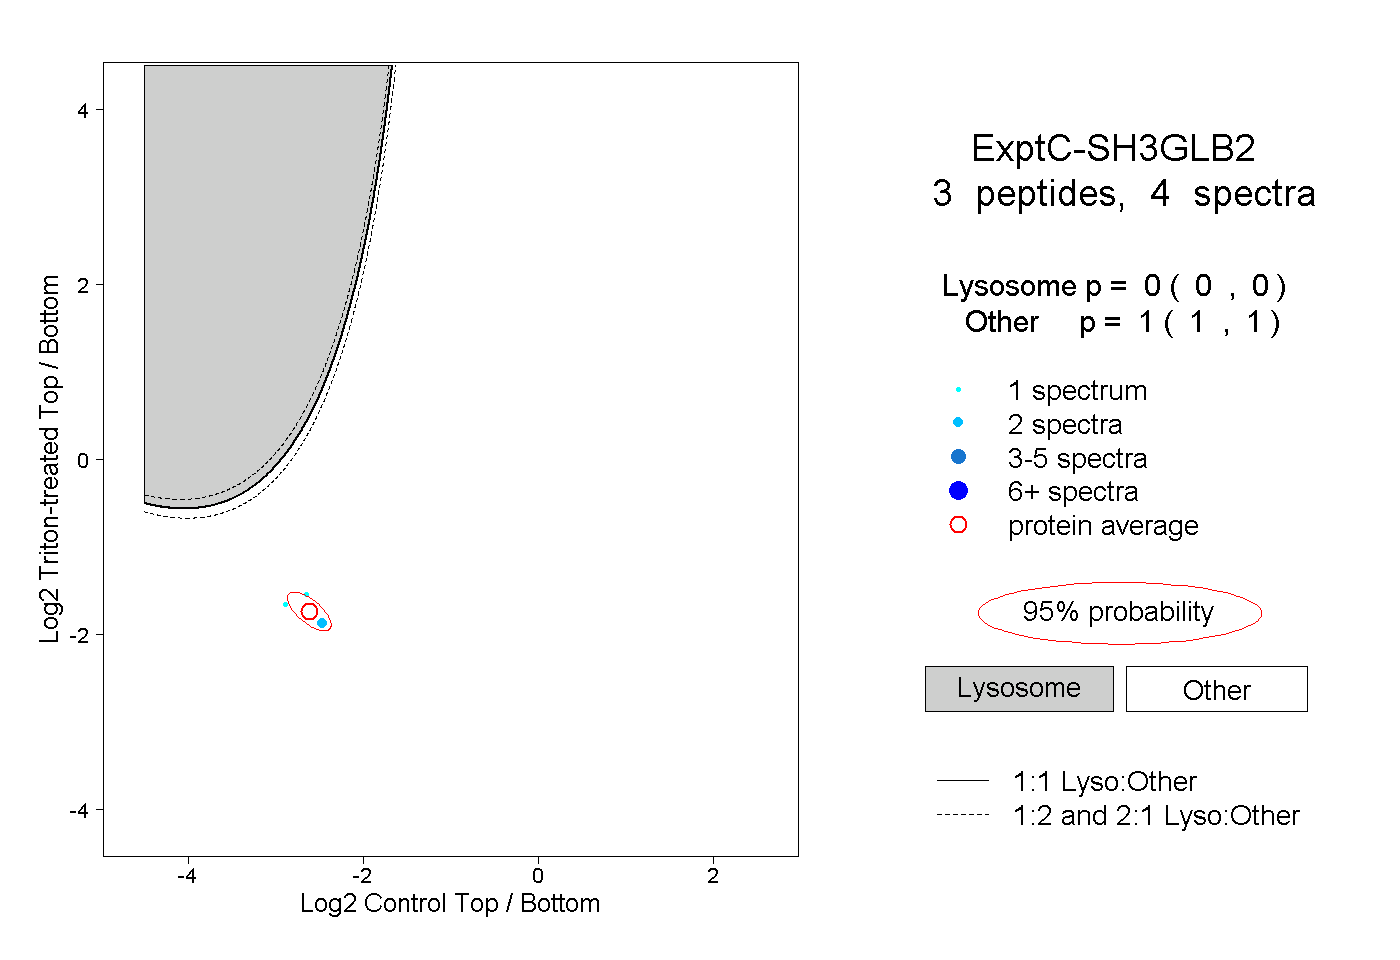
| Plot | Lyso | Other | |||||||||||
| Expt C |
3 peptides |
4 spectra |
|
0.000 0.000 | 0.000 |
1.000 1.000 | 1.000 |