 9
9peptides
spectra
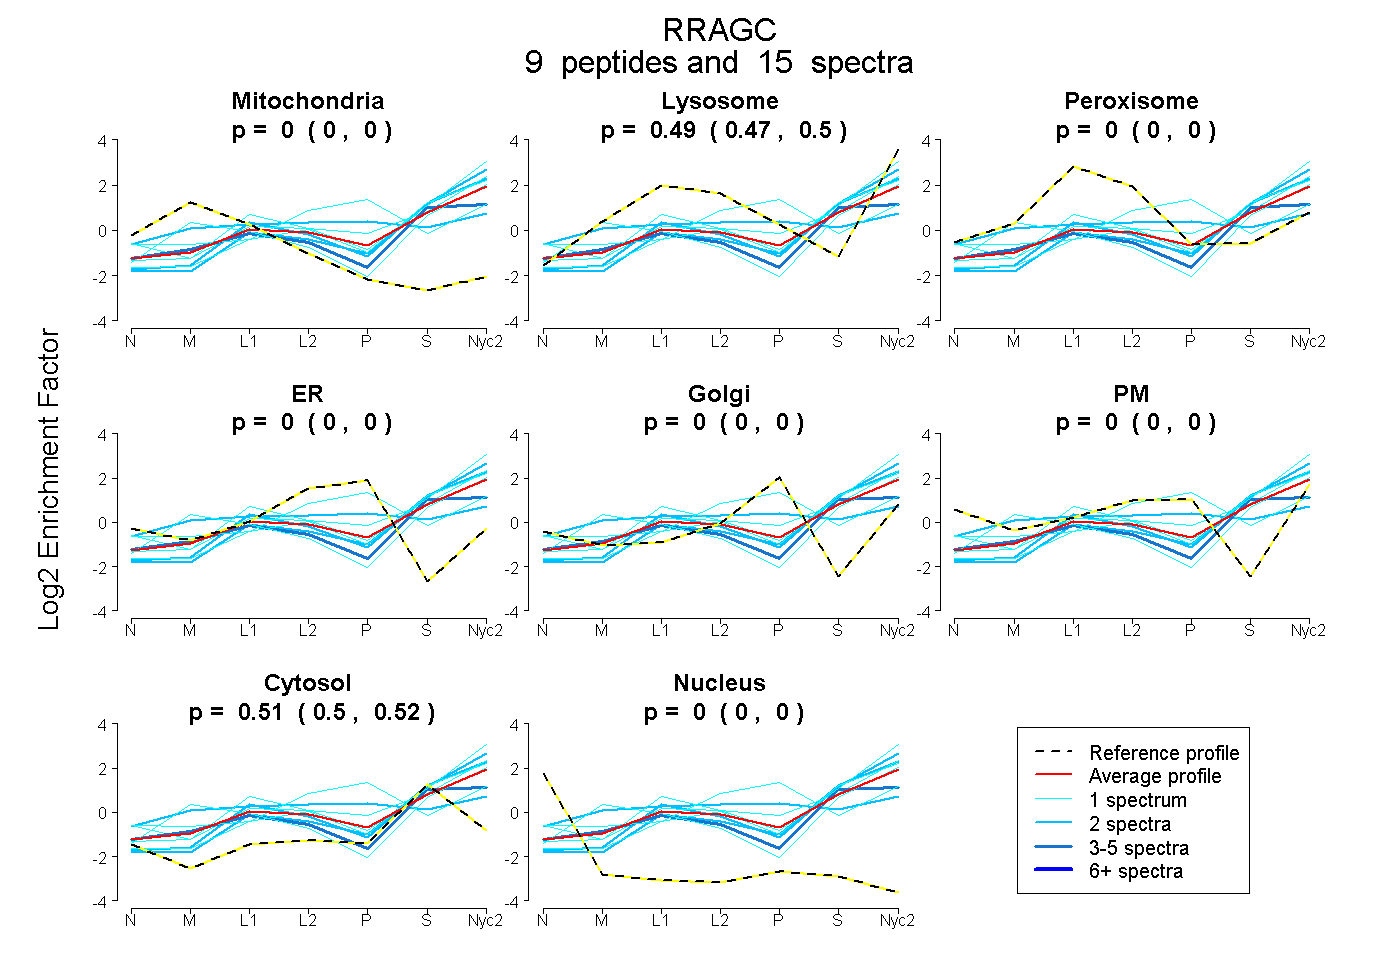
0.000 | 0.000
0.475 | 0.501
0.000 | 0.000
0.000 | 0.000
0.000 | 0.000
0.000 | 0.000
0.497 | 0.523
0.000 | 0.000
| Plot | Mito | Lyso | Perox | ER | Golgi | PM | Cytosol | Nucleus | |||||
| Expt A |
9 peptides |
15 spectra |
|
0.000 0.000 | 0.000 |
0.489 0.475 | 0.501 |
0.000 0.000 | 0.000 |
0.000 0.000 | 0.000 |
0.000 0.000 | 0.000 |
0.000 0.000 | 0.000 |
0.511 0.497 | 0.523 |
0.000 0.000 | 0.000 |
| 2 spectra, ANDDLADAGLEK | 0.000 | 0.499 | 0.000 | 0.000 | 0.000 | 0.000 | 0.501 | 0.000 | ||
| 1 spectrum, ESMAIIK | 0.000 | 0.523 | 0.000 | 0.000 | 0.000 | 0.014 | 0.462 | 0.000 | ||
| 2 spectra, AIHEVFEVGVTSHR | 0.007 | 0.161 | 0.304 | 0.000 | 0.244 | 0.000 | 0.284 | 0.000 | ||
| 2 spectra, AFLFDVVSK | 0.000 | 0.420 | 0.000 | 0.000 | 0.000 | 0.000 | 0.580 | 0.000 | ||
| 1 spectrum, MSPNETLFLESTNK | 0.000 | 0.428 | 0.000 | 0.000 | 0.000 | 0.000 | 0.572 | 0.000 | ||
| 1 spectrum, VNPDMNFEVFIHK | 0.000 | 0.591 | 0.000 | 0.000 | 0.000 | 0.000 | 0.409 | 0.000 | ||
| 1 spectrum, LHITVSK | 0.000 | 0.301 | 0.000 | 0.173 | 0.280 | 0.000 | 0.246 | 0.000 | ||
| 1 spectrum, LNNTTVLYLK | 0.102 | 0.450 | 0.000 | 0.000 | 0.000 | 0.000 | 0.448 | 0.000 | ||
| 4 spectra, GLIDYNFHCFR | 0.014 | 0.353 | 0.002 | 0.000 | 0.000 | 0.000 | 0.631 | 0.000 |
| Plot | Lyso | Other | |||||||||||
| Expt C |
8 peptides |
24 spectra |
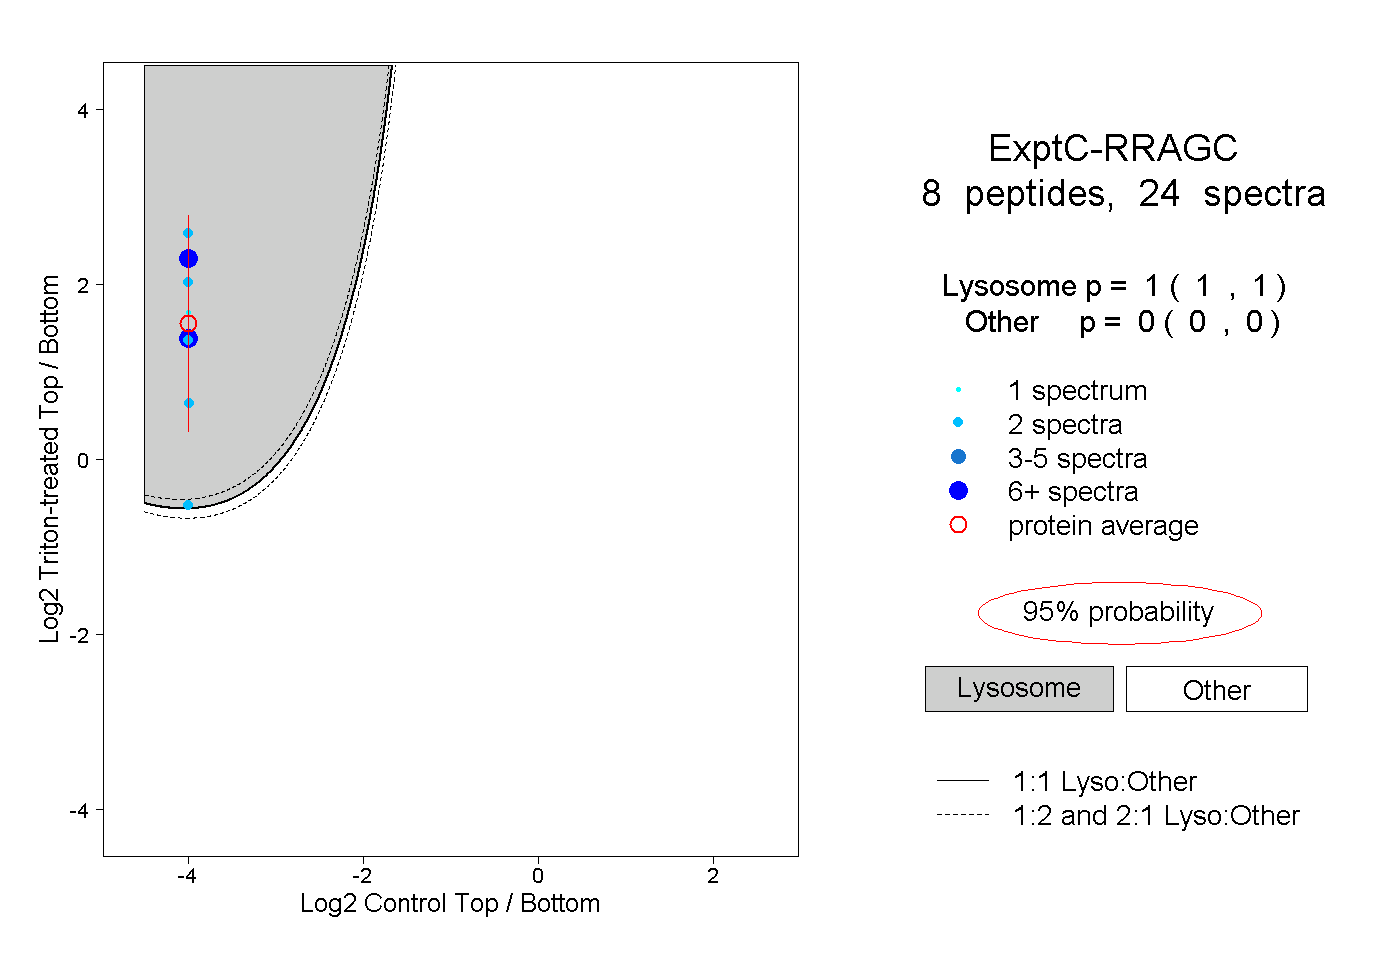 |
1.000 1.000 | 1.000 |
0.000 0.000 | 0.000 |
||||||||
| Plot | Lyso | Other | |||||||||||
| Expt D |
3 peptides |
5 spectra |
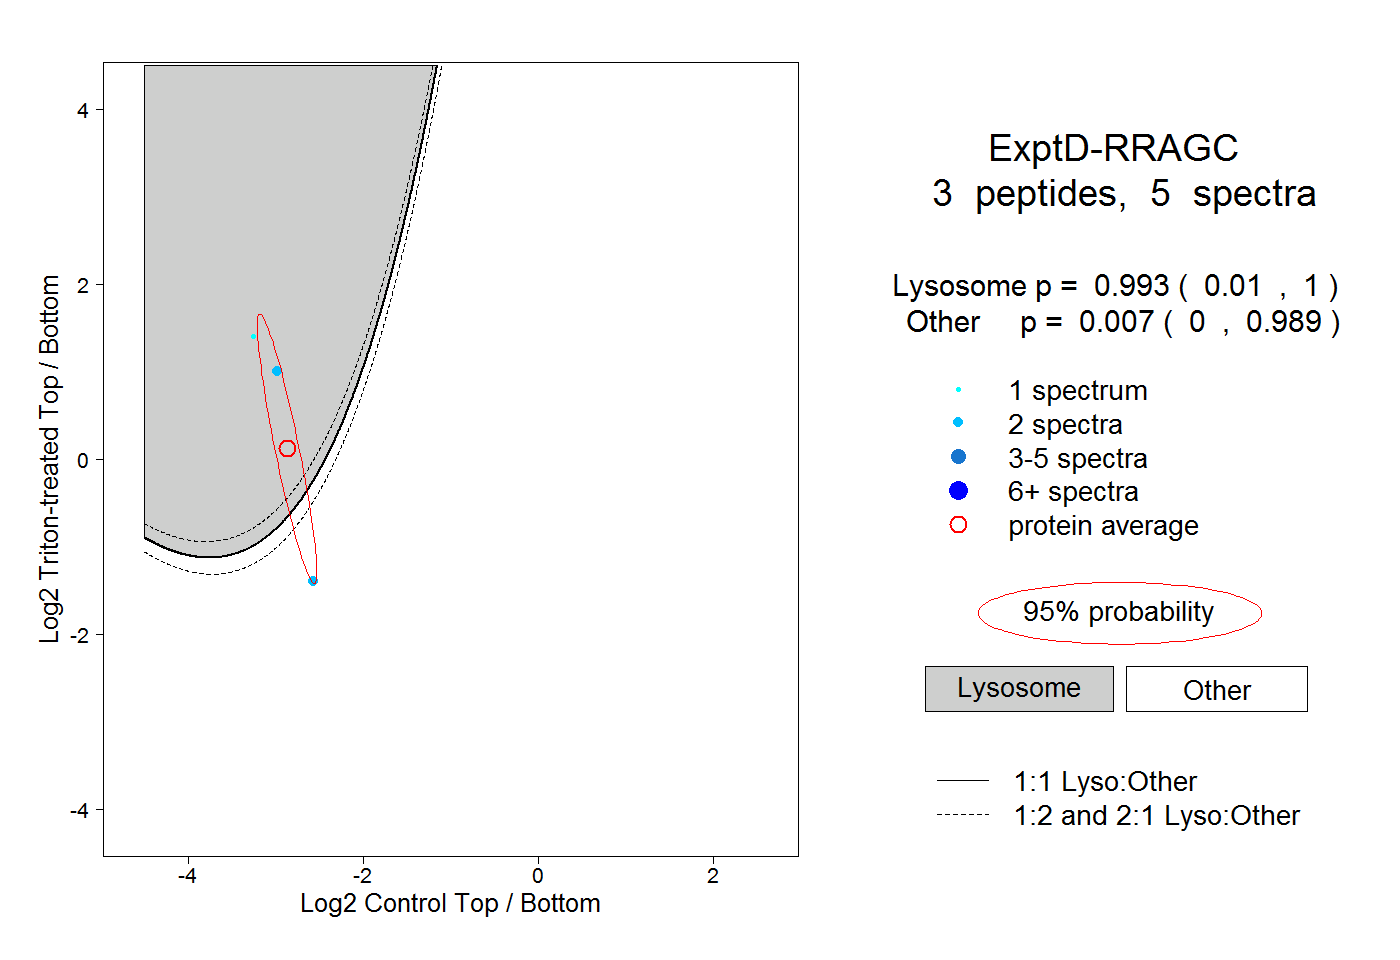 |
0.993 0.010 | 1.000 |
0.007 0.000 | 0.989 |