 2
2peptides
spectra
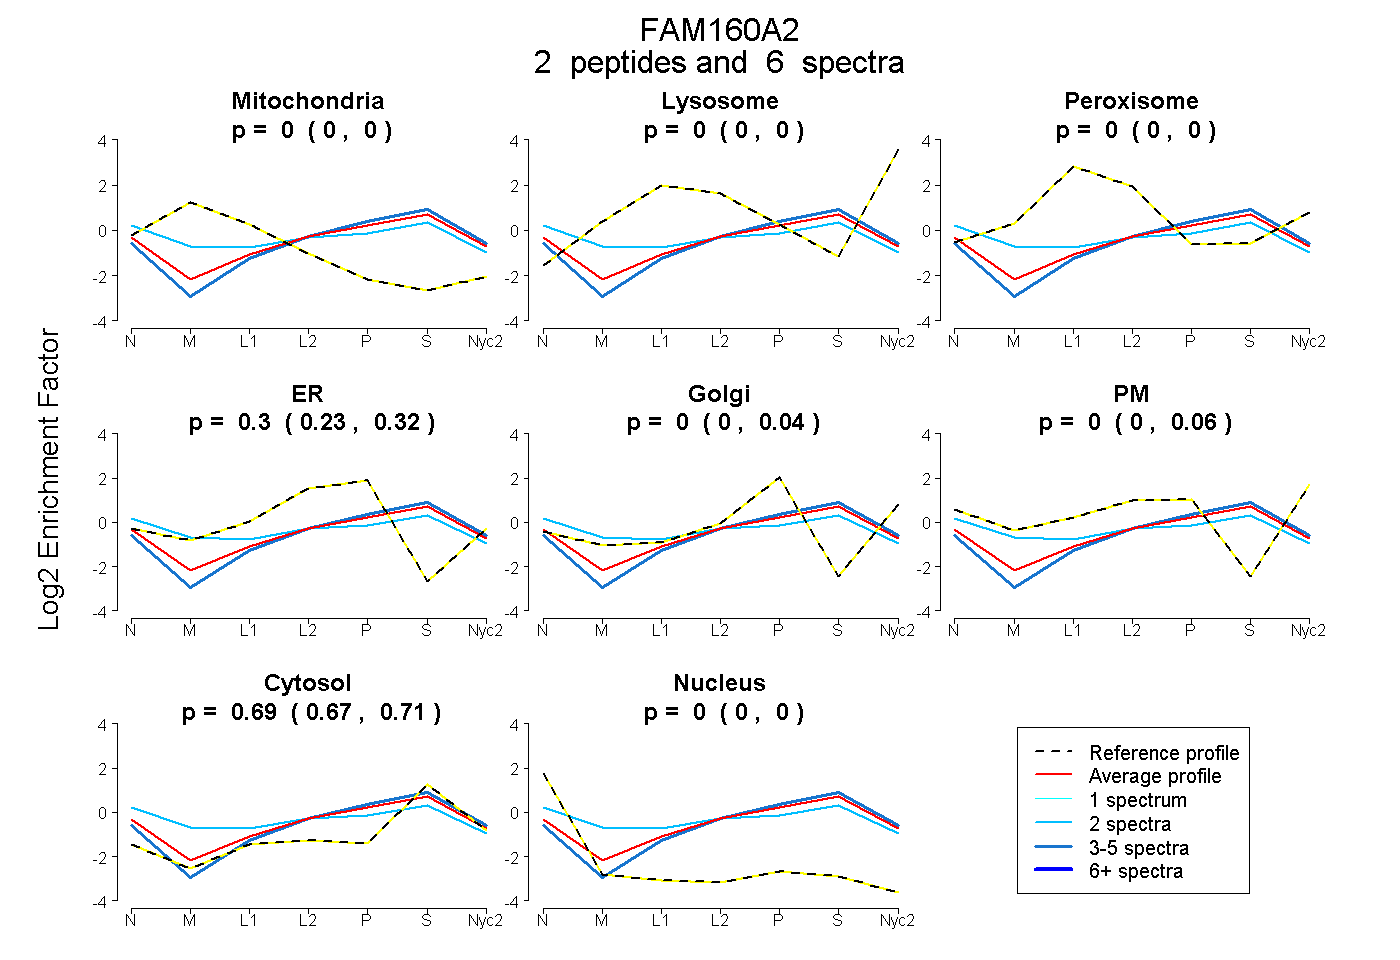
0.000 | 0.000
0.000 | 0.000
0.000 | 0.000
0.228 | 0.317
0.000 | 0.039
0.000 | 0.064
0.668 | 0.709
0.000 | 0.000
1peptide
spectra
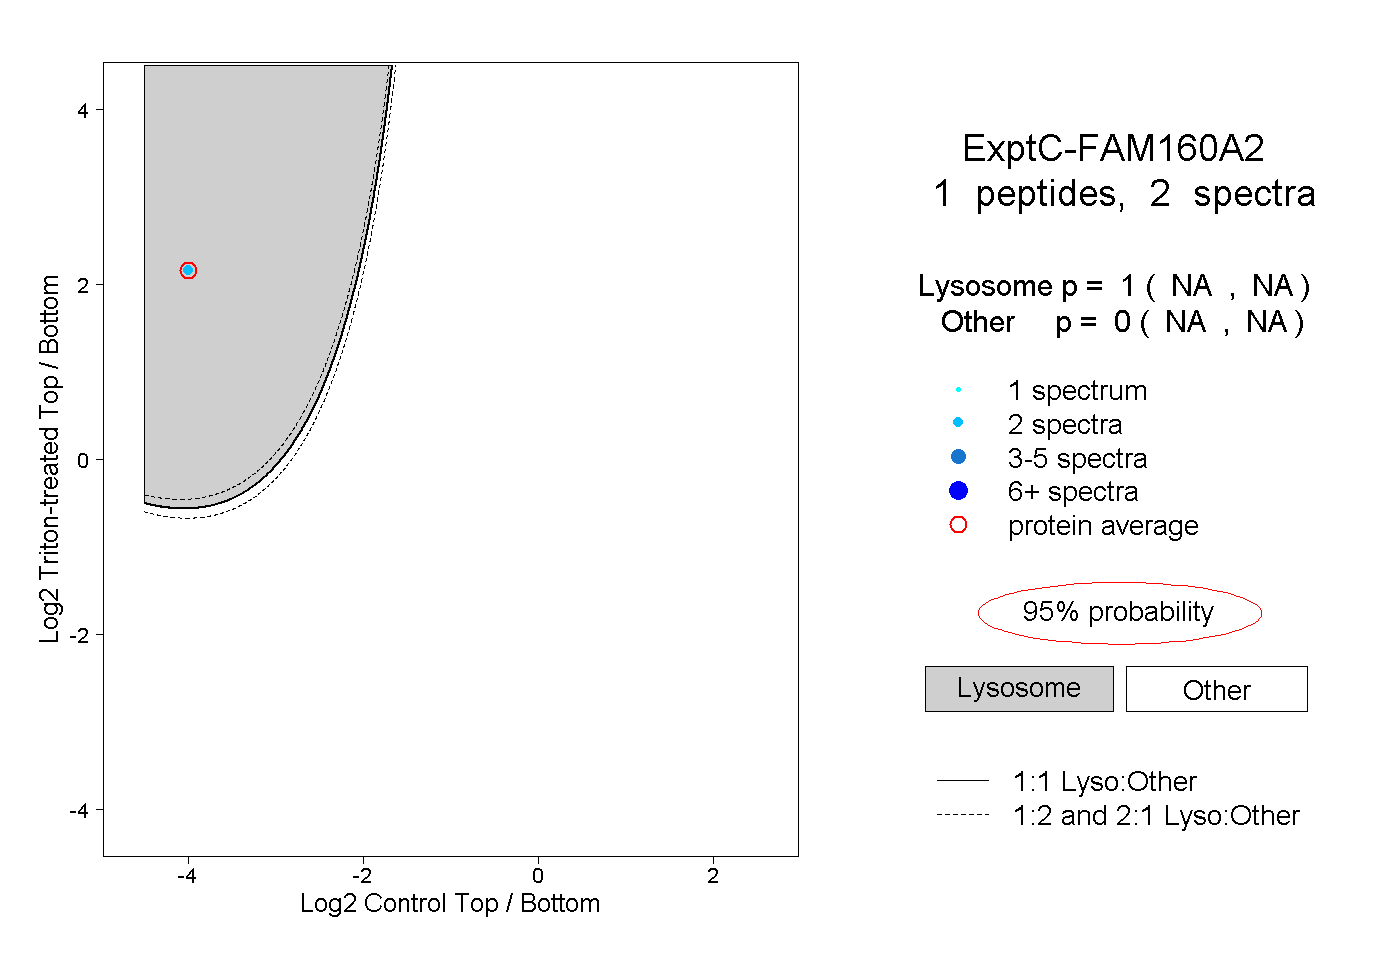
NA | NA
NA | NA
| Plot | Mito | Lyso | Perox | ER | Golgi | PM | Cytosol | Nucleus | |||||
| Expt A |
2 peptides |
6 spectra |
|
0.000 0.000 | 0.000 |
0.000 0.000 | 0.000 |
0.000 0.000 | 0.000 |
0.304 0.228 | 0.317 |
0.003 0.000 | 0.039 |
0.002 0.000 | 0.064 |
0.692 0.668 | 0.709 |
0.000 0.000 | 0.000 |
||
| Plot | Lyso | Other | |||||||||||
| Expt C |
1 peptide |
2 spectra |
|
1.000 NA | NA |
0.000 NA | NA |