 3
3peptides
spectra
0.218 | 0.271
0.000 | 0.000
0.213 | 0.308
0.270 | 0.395
0.000 | 0.000
0.062 | 0.224
0.000 | 0.000
0.000 | 0.000
5peptides
spectra
0.000 | 0.000
1.000 | 1.000
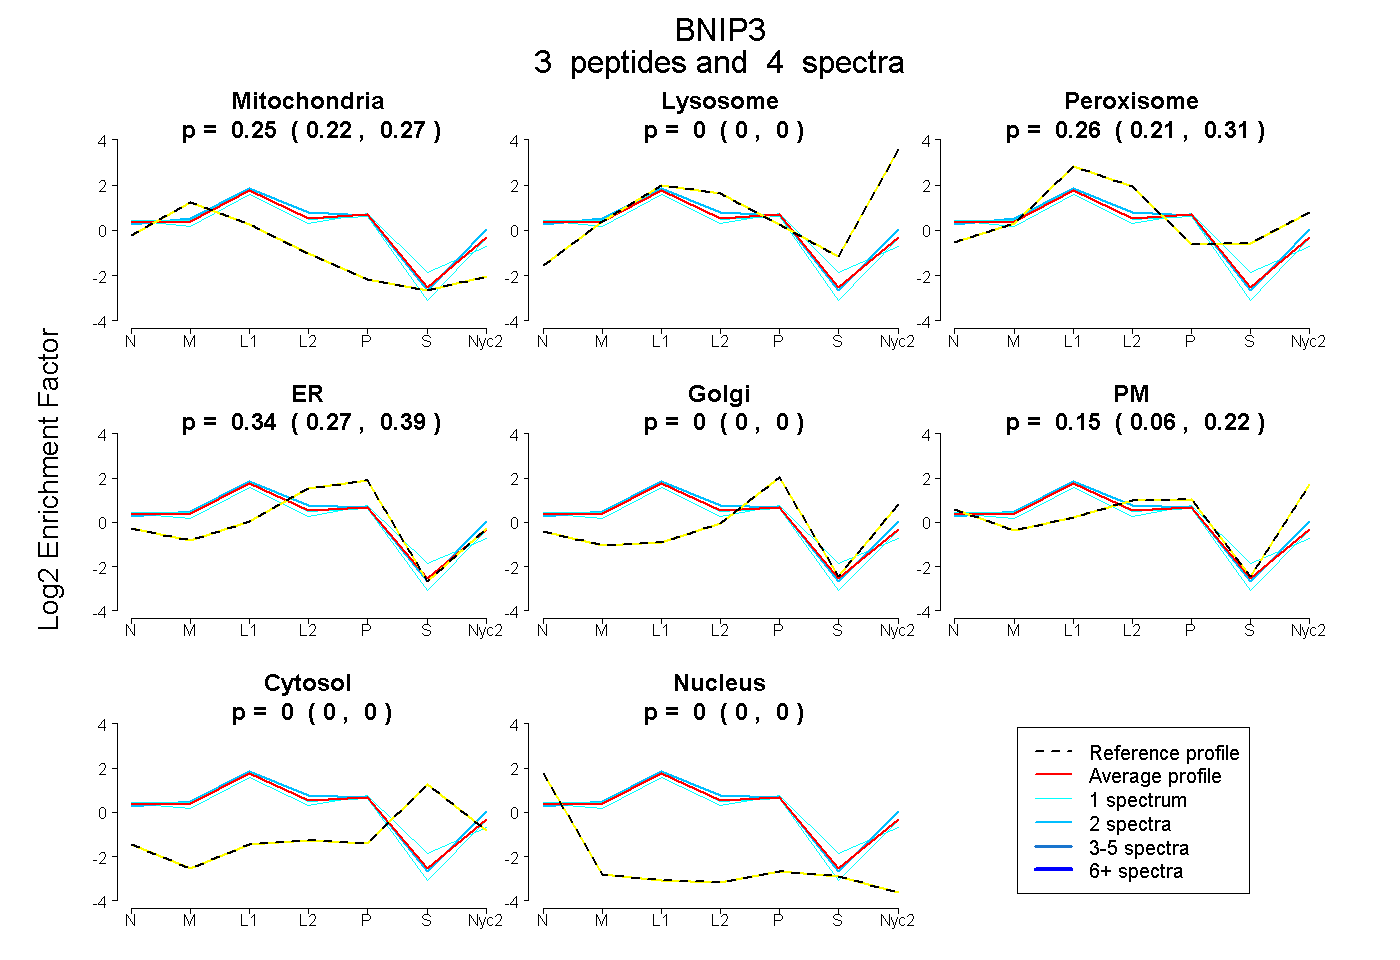
| Plot | Mito | Lyso | Perox | ER | Golgi | PM | Cytosol | Nucleus | |||||
| Expt A |
3 peptides |
4 spectra |
|
0.246 0.218 | 0.271 |
0.000 0.000 | 0.000 |
0.265 0.213 | 0.308 |
0.338 0.270 | 0.395 |
0.000 0.000 | 0.000 |
0.152 0.062 | 0.224 |
0.000 0.000 | 0.000 |
0.000 0.000 | 0.000 |
||
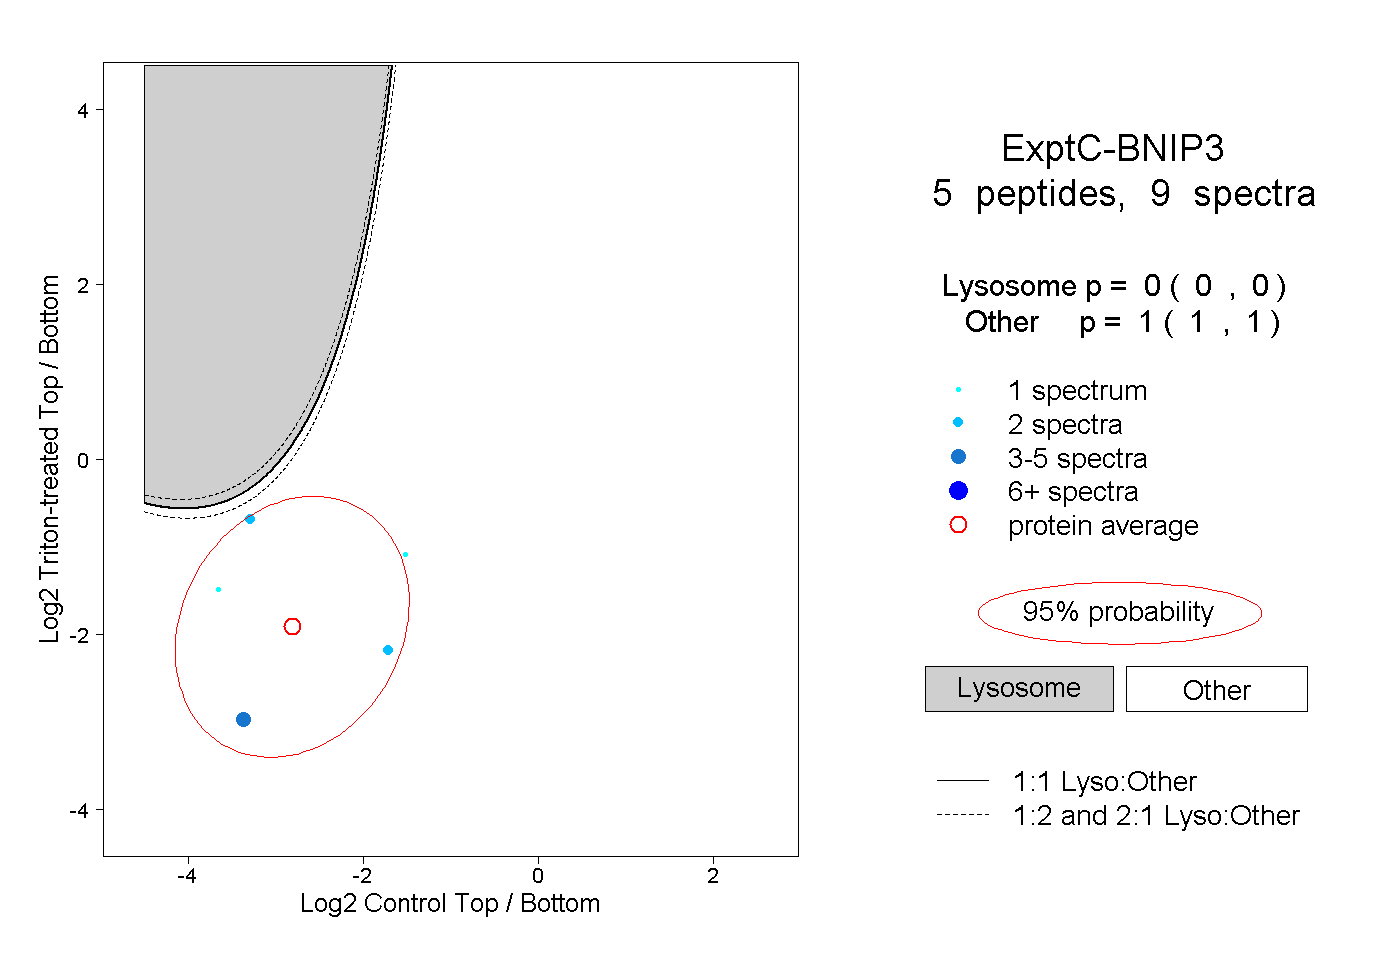
| Plot | Lyso | Other | |||||||||||
| Expt C |
5 peptides |
9 spectra |
|
0.000 0.000 | 0.000 |
1.000 1.000 | 1.000 |