 3
3peptides
spectra
0.000 | 0.044
0.000 | 0.000
0.000 | 0.093
0.000 | 0.274
0.000 | 0.306
0.000 | 0.266
0.499 | 0.637
0.000 | 0.045
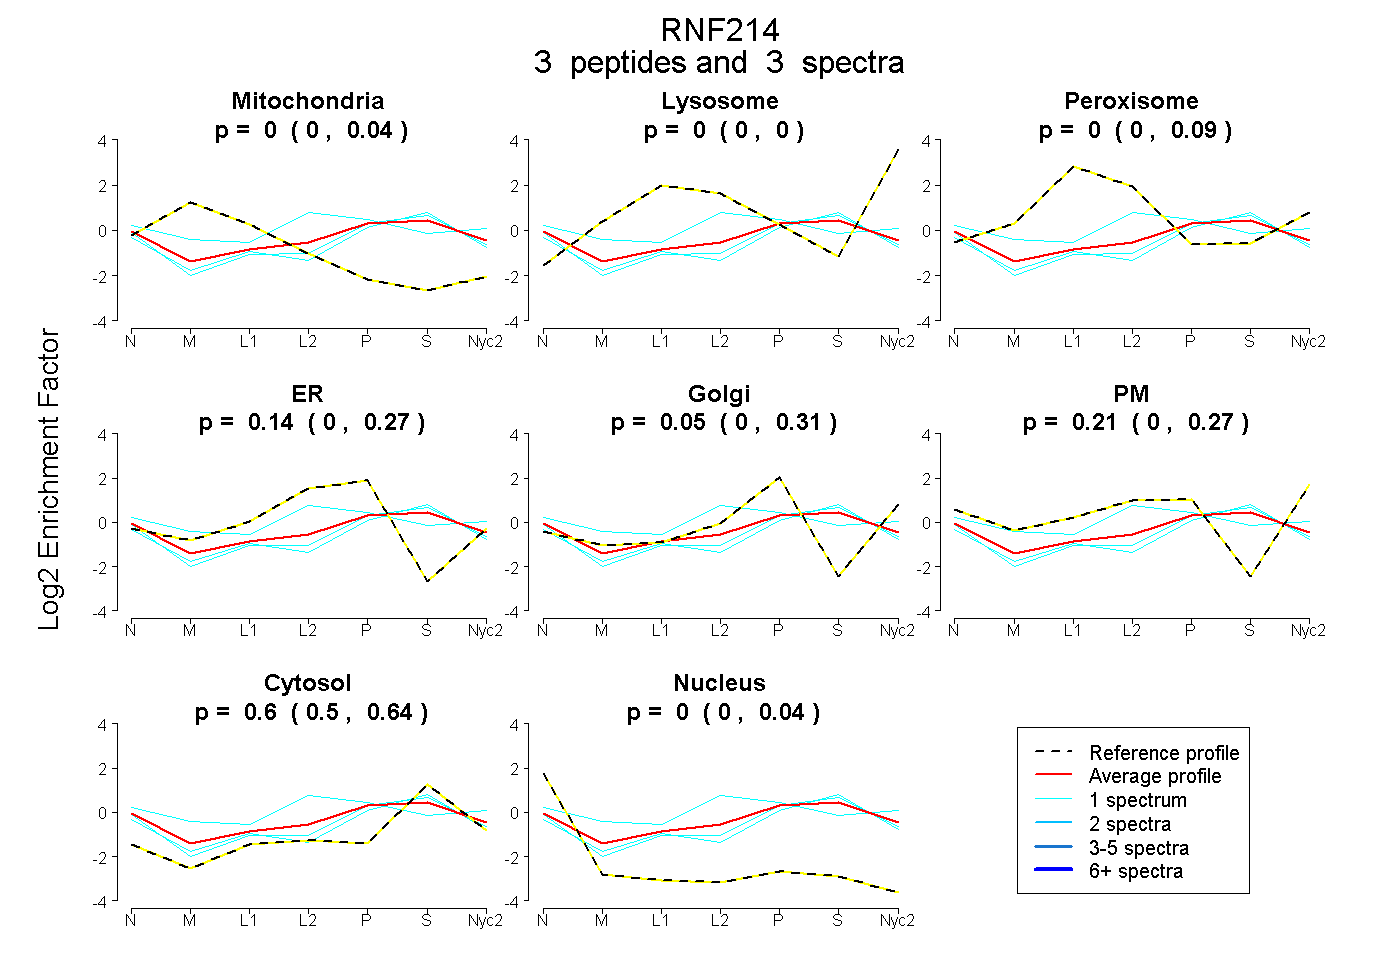
| Plot | Mito | Lyso | Perox | ER | Golgi | PM | Cytosol | Nucleus | |||||
| Expt A |
3 peptides |
3 spectra |
|
0.000 0.000 | 0.044 |
0.000 0.000 | 0.000 |
0.000 0.000 | 0.093 |
0.136 0.000 | 0.274 |
0.053 0.000 | 0.306 |
0.206 0.000 | 0.266 |
0.604 0.499 | 0.637 |
0.000 0.000 | 0.045 |
| 1 spectrum, EVWEMELDR | 0.000 | 0.000 | 0.000 | 0.033 | 0.261 | 0.034 | 0.653 | 0.019 | ||
| 1 spectrum, YQEVLDK | 0.000 | 0.000 | 0.031 | 0.000 | 0.256 | 0.000 | 0.686 | 0.026 | ||
| 1 spectrum, DQFNSHIQLVR | 0.000 | 0.000 | 0.130 | 0.192 | 0.000 | 0.325 | 0.353 | 0.000 |