 21
21peptides
spectra
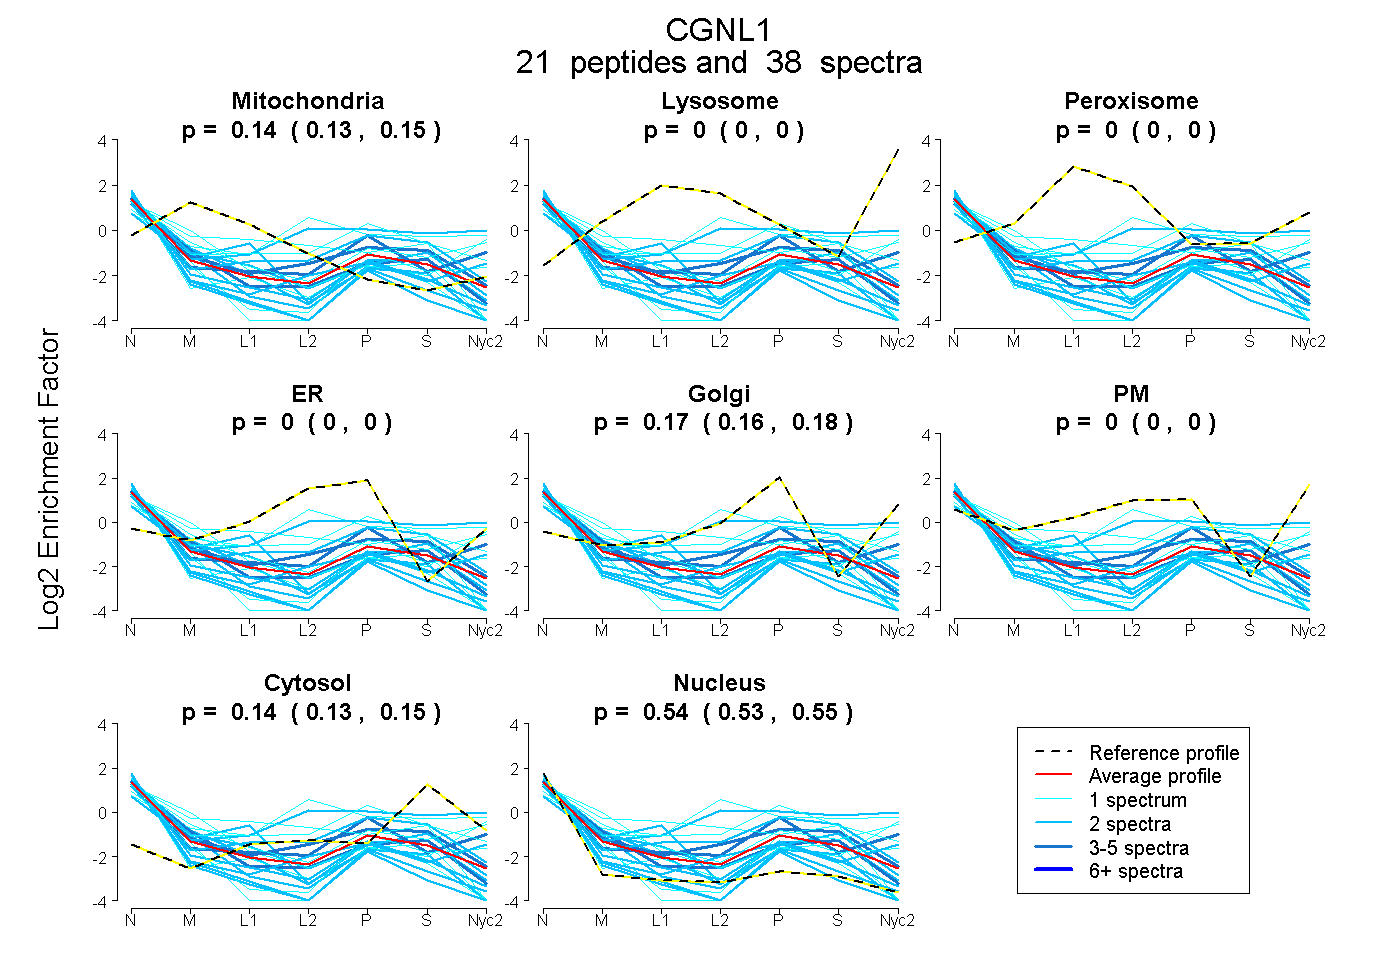
0.131 | 0.152
0.000 | 0.000
0.000 | 0.000
0.000 | 0.000
0.157 | 0.179
0.000 | 0.000
0.132 | 0.152
0.534 | 0.553
6peptides
spectra
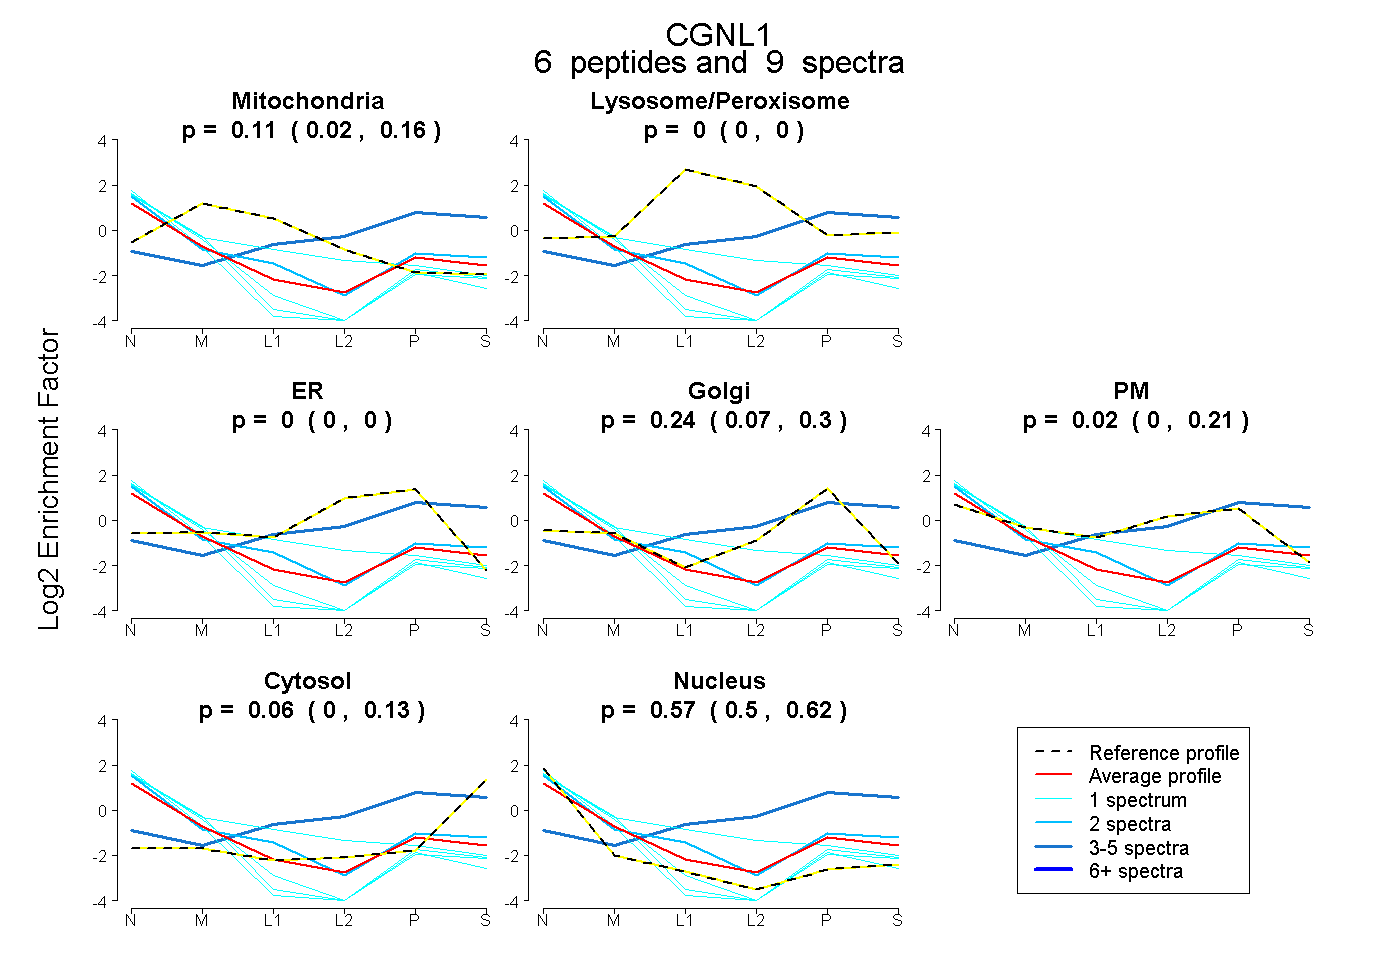
0.020 | 0.160
0.000 | 0.000
0.000 | 0.000
0.068 | 0.304
0.000 | 0.205
0.000 | 0.125
0.495 | 0.621
4peptides
spectra
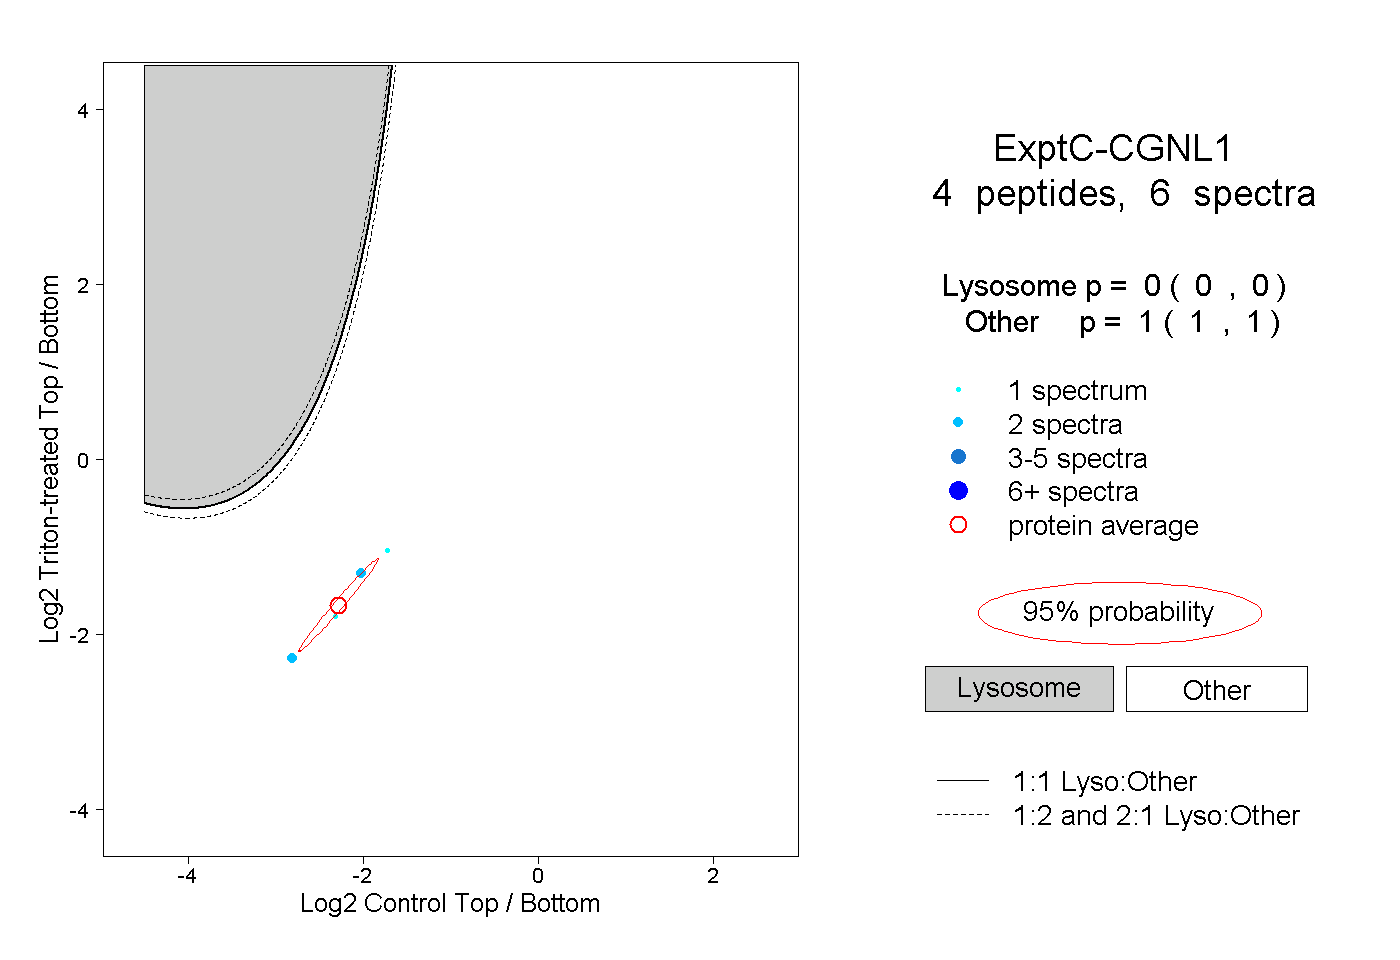
0.000 | 0.000
1.000 | 1.000