 10
10peptides
spectra
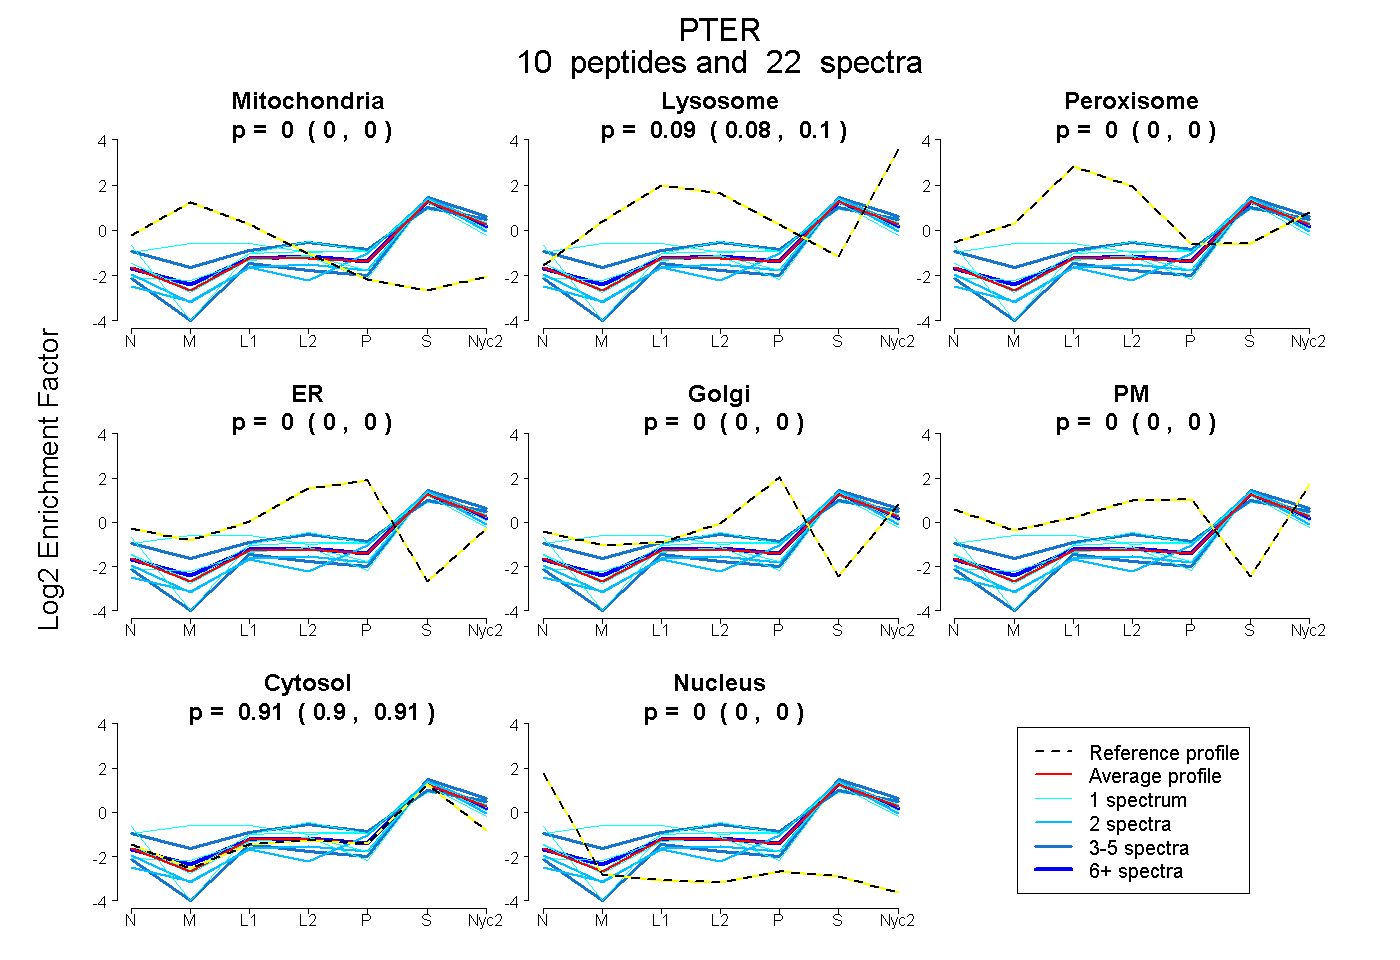
0.000 | 0.000
0.084 | 0.101
0.000 | 0.000
0.000 | 0.000
0.000 | 0.000
0.000 | 0.000
0.898 | 0.914
0.000 | 0.000
2peptides
spectra
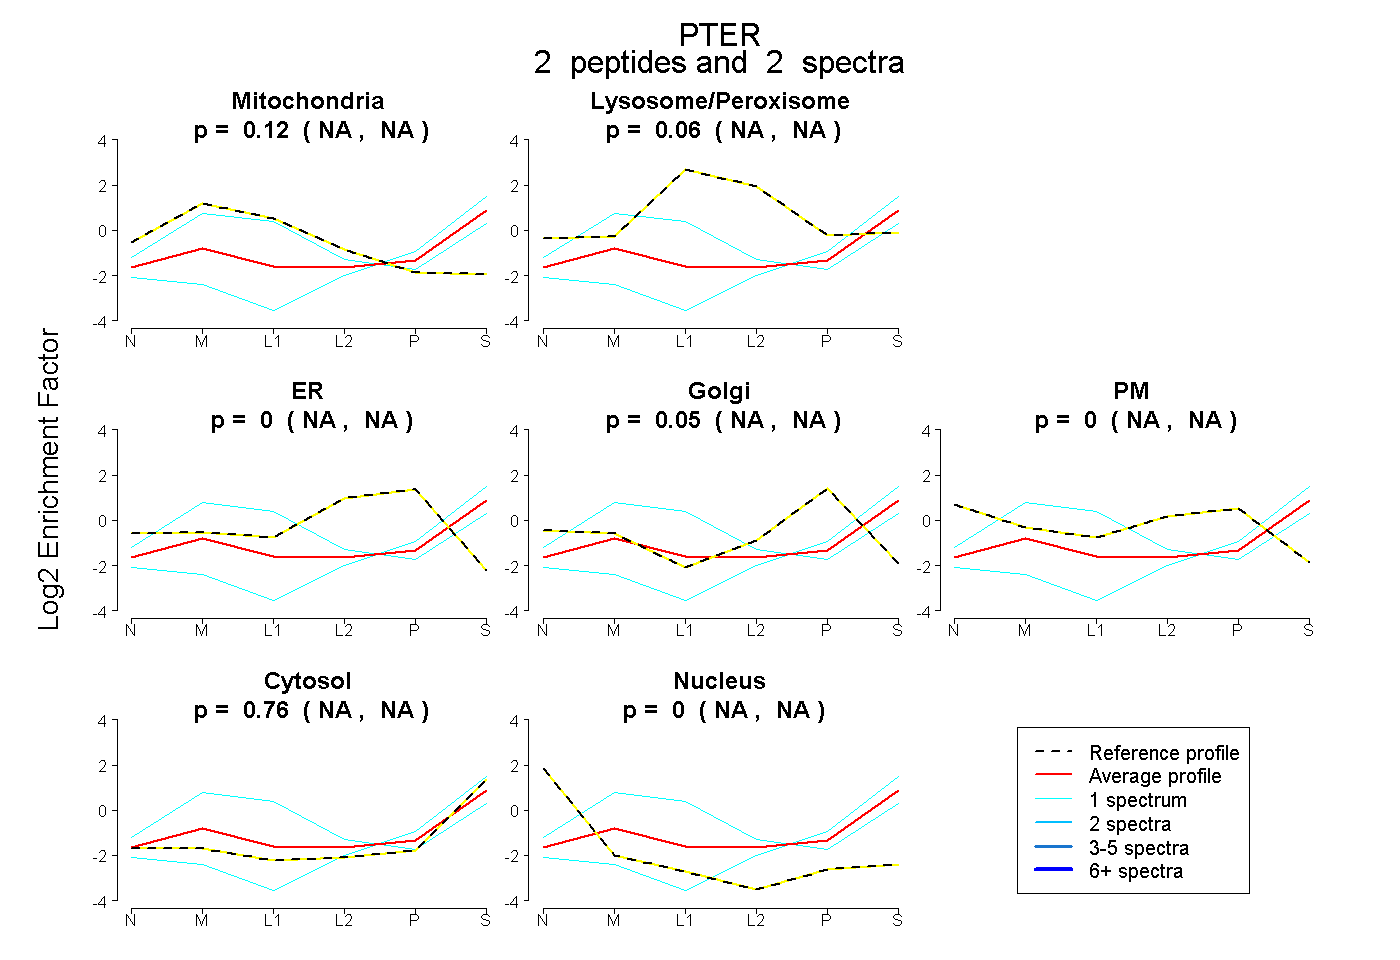
NA | NA
NA | NA
NA | NA
NA | NA
NA | NA
NA | NA
NA | NA
6peptides
spectra
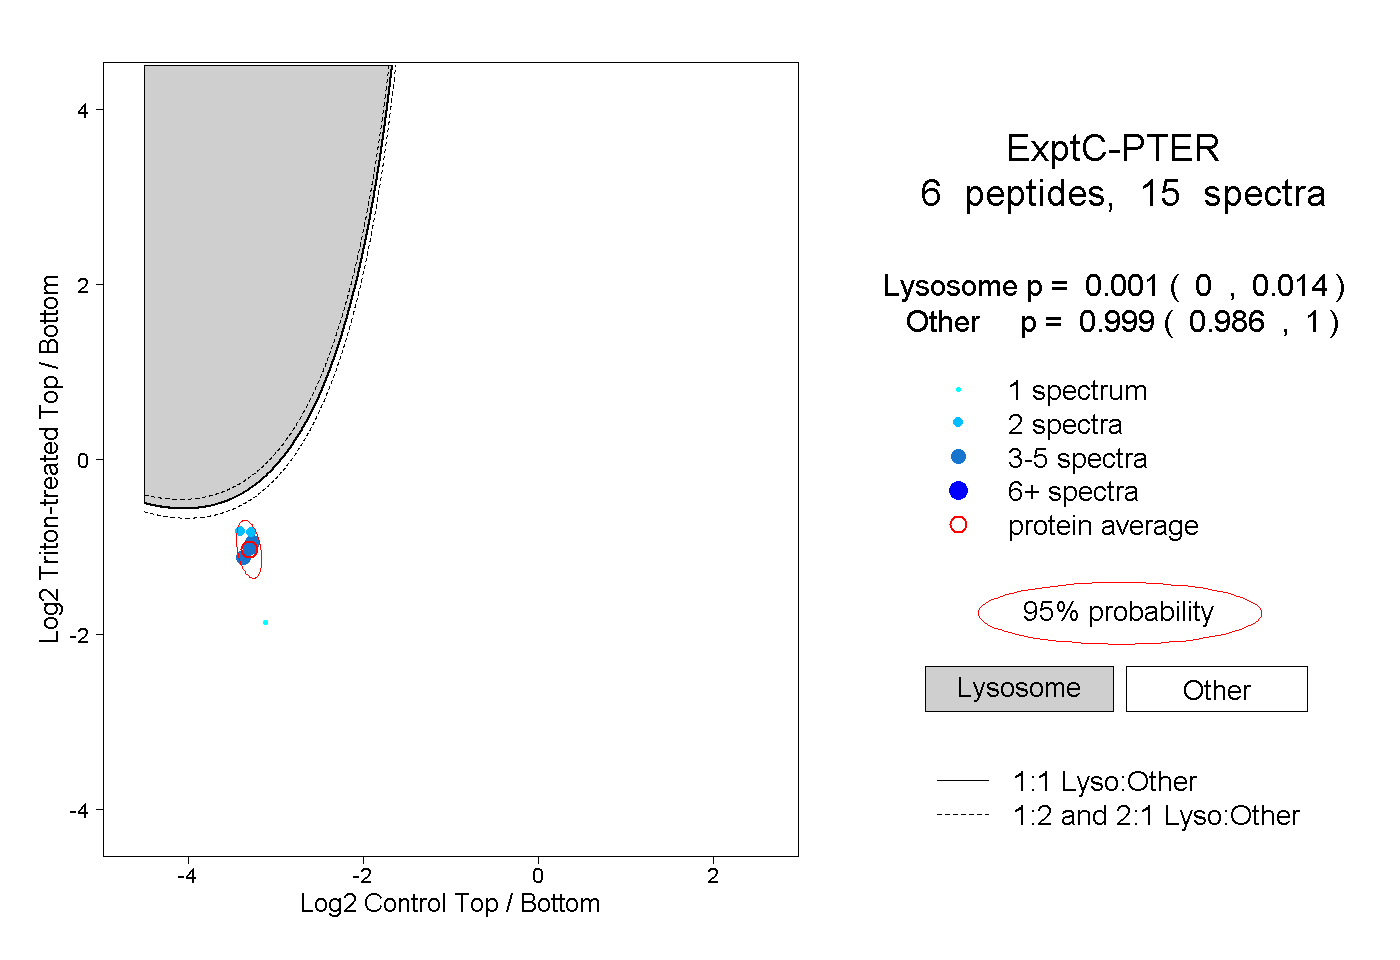
0.000 | 0.014
0.986 | 1.000