 10
10peptides
spectra
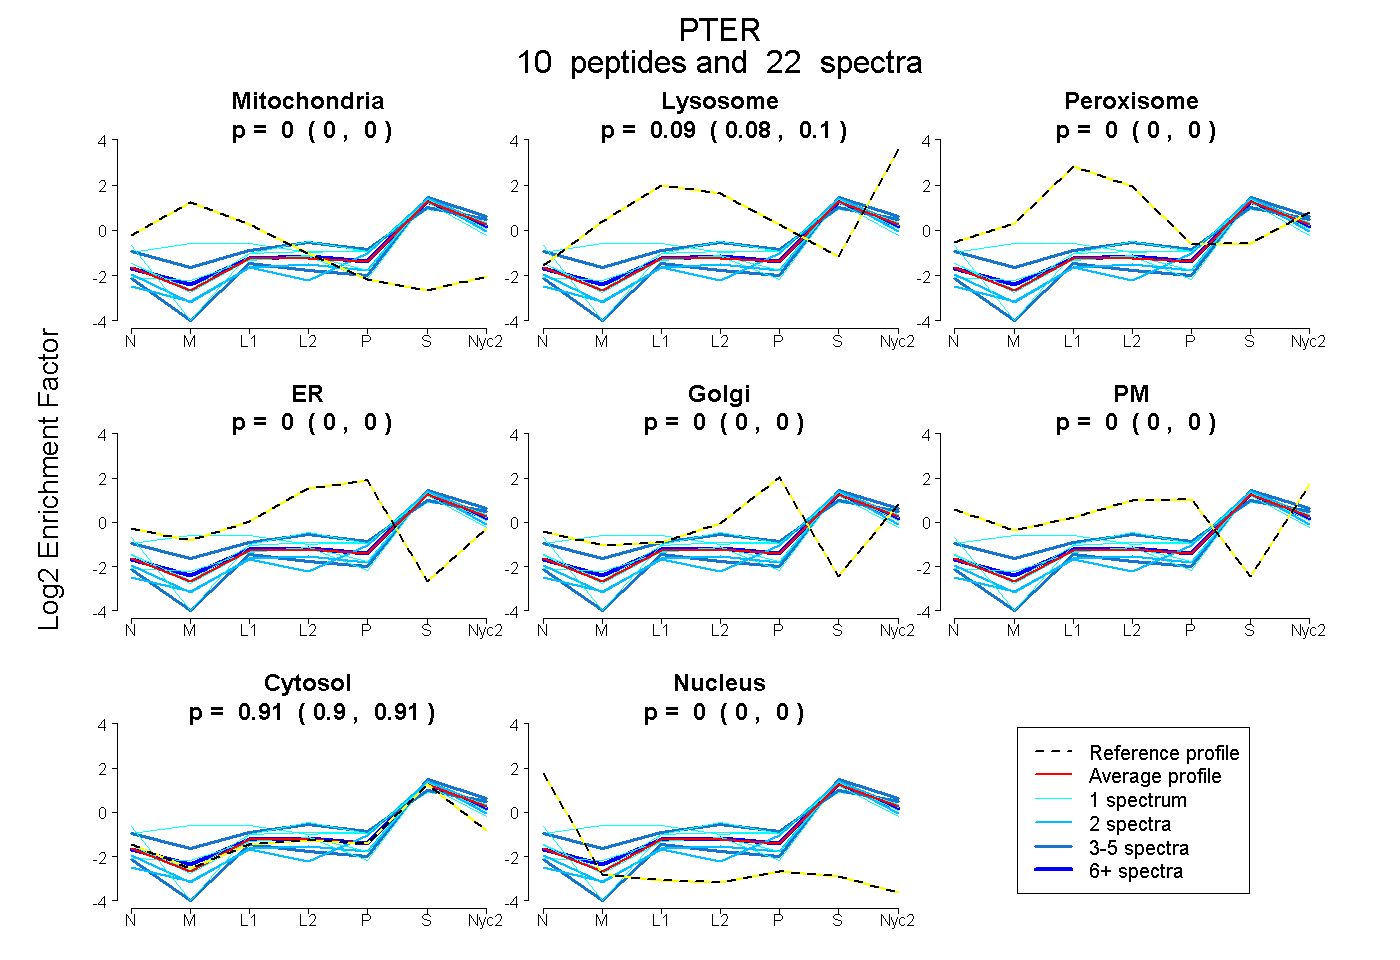
0.000 | 0.000
0.084 | 0.101
0.000 | 0.000
0.000 | 0.000
0.000 | 0.000
0.000 | 0.000
0.898 | 0.914
0.000 | 0.000
| Plot | Mito | Lyso | Perox | ER | Golgi | PM | Cytosol | Nucleus | |||||
| Expt A |
10 peptides |
22 spectra |
|
0.000 0.000 | 0.000 |
0.093 0.084 | 0.101 |
0.000 0.000 | 0.000 |
0.000 0.000 | 0.000 |
0.000 0.000 | 0.000 |
0.000 0.000 | 0.000 |
0.907 0.898 | 0.914 |
0.000 0.000 | 0.000 |
| 1 spectrum, QWLTFK | 0.000 | 0.062 | 0.000 | 0.000 | 0.000 | 0.000 | 0.938 | 0.000 | ||
| 2 spectra, NPGAPFQIIR | 0.000 | 0.012 | 0.000 | 0.000 | 0.000 | 0.000 | 0.988 | 0.000 | ||
| 1 spectrum, EELLYFK | 0.091 | 0.273 | 0.000 | 0.000 | 0.000 | 0.000 | 0.637 | 0.000 | ||
| 2 spectra, NPYSHQENLQLNQEVEAVR | 0.000 | 0.000 | 0.000 | 0.000 | 0.000 | 0.000 | 1.000 | 0.000 | ||
| 1 spectrum, VQTVLGPVEPSQLGR | 0.000 | 0.143 | 0.000 | 0.000 | 0.000 | 0.000 | 0.857 | 0.000 | ||
| 3 spectra, TVMSHLDR | 0.000 | 0.201 | 0.000 | 0.000 | 0.000 | 0.059 | 0.740 | 0.000 | ||
| 1 spectrum, VLQATAHAQAQLGCPVIIHPGR | 0.000 | 0.000 | 0.000 | 0.000 | 0.000 | 0.085 | 0.915 | 0.000 | ||
| 1 spectrum, NLFWIQK | 0.000 | 0.085 | 0.000 | 0.000 | 0.000 | 0.000 | 0.915 | 0.000 | ||
| 3 spectra, GGGAVVENTTTGLSR | 0.000 | 0.000 | 0.000 | 0.000 | 0.000 | 0.000 | 1.000 | 0.000 | ||
| 7 spectra, ILMAHDIHTK | 0.000 | 0.102 | 0.000 | 0.000 | 0.000 | 0.000 | 0.898 | 0.000 |
| Plot | Mito | Lyso or Perox | ER | Golgi | PM | Cytosol | Nucleus | ||||||
| Expt B |
2 peptides |
2 spectra |
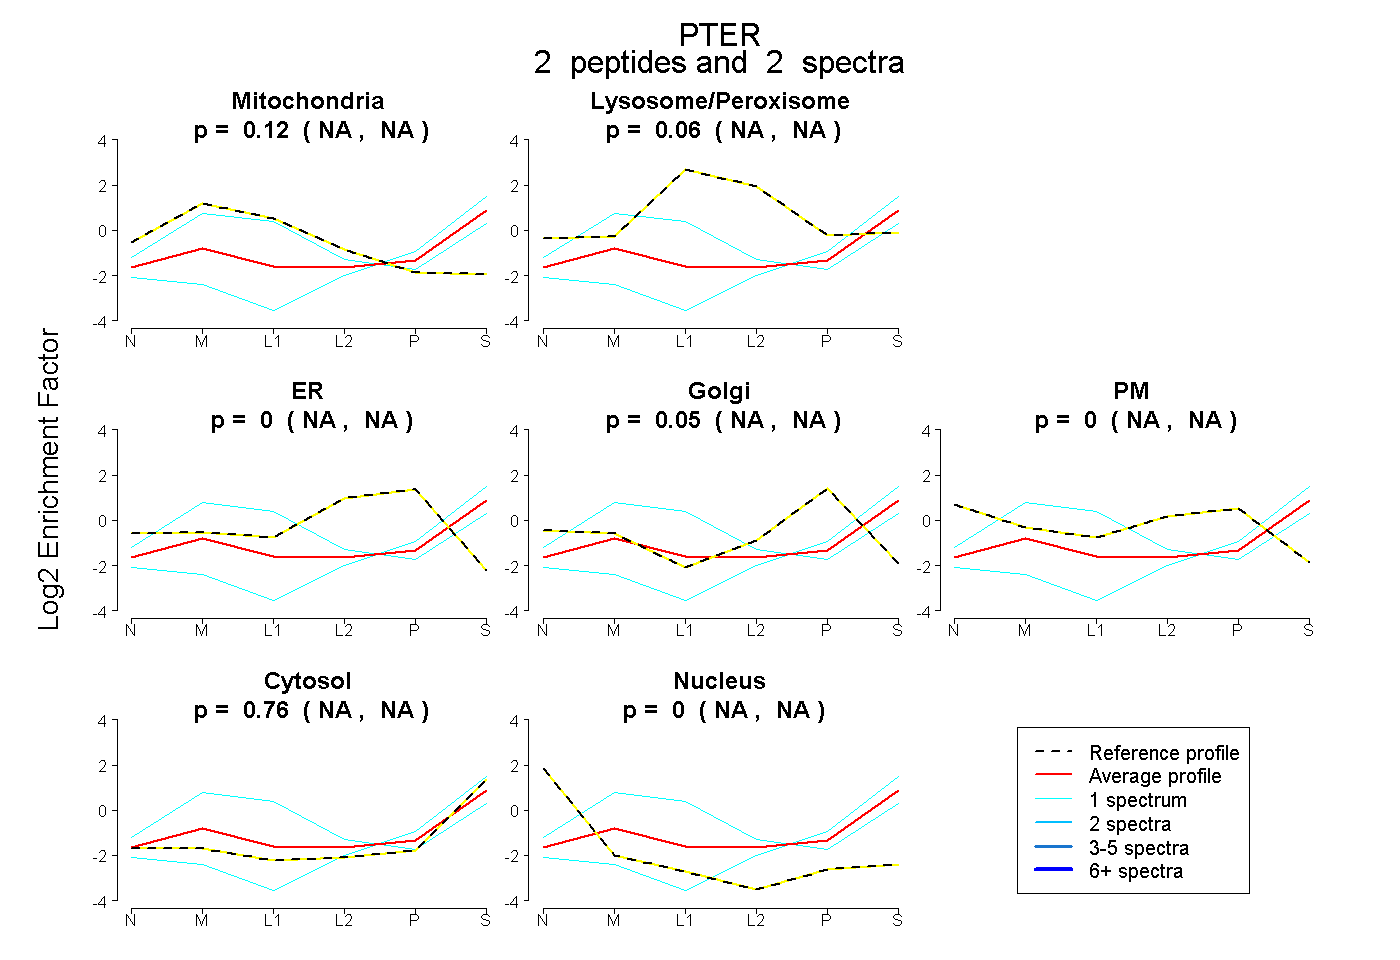 |
0.122 NA | NA |
0.063 NA | NA |
0.000 NA | NA |
0.054 NA | NA |
0.000 NA | NA |
0.761 NA | NA |
0.000 NA | NA |
|||
| Plot | Lyso | Other | |||||||||||
| Expt C |
6 peptides |
15 spectra |
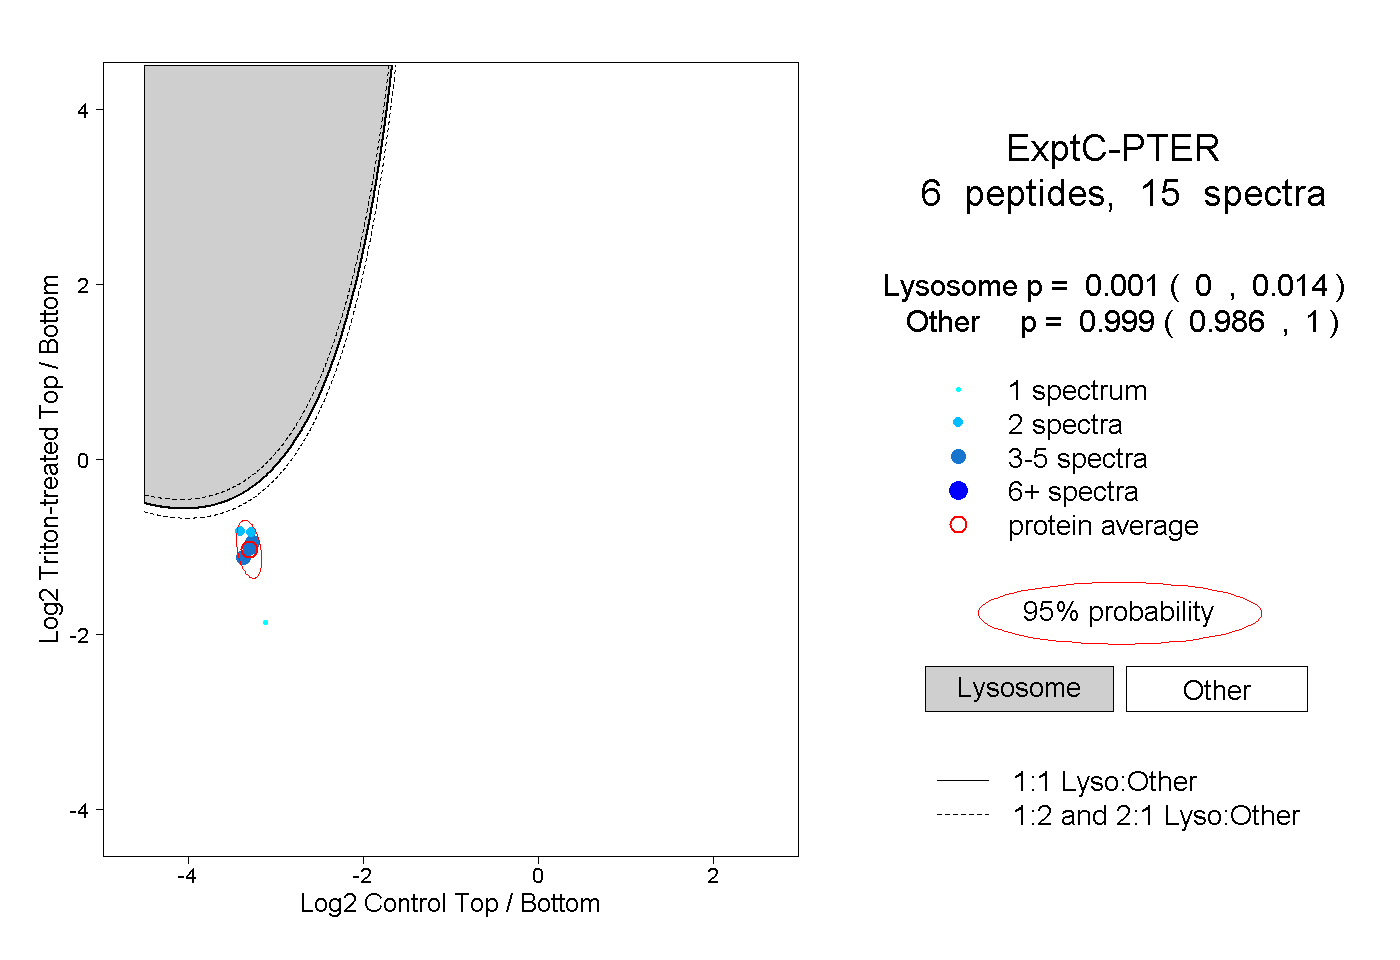 |
0.001 0.000 | 0.014 |
0.999 0.986 | 1.000 |