 3
3peptides
spectra
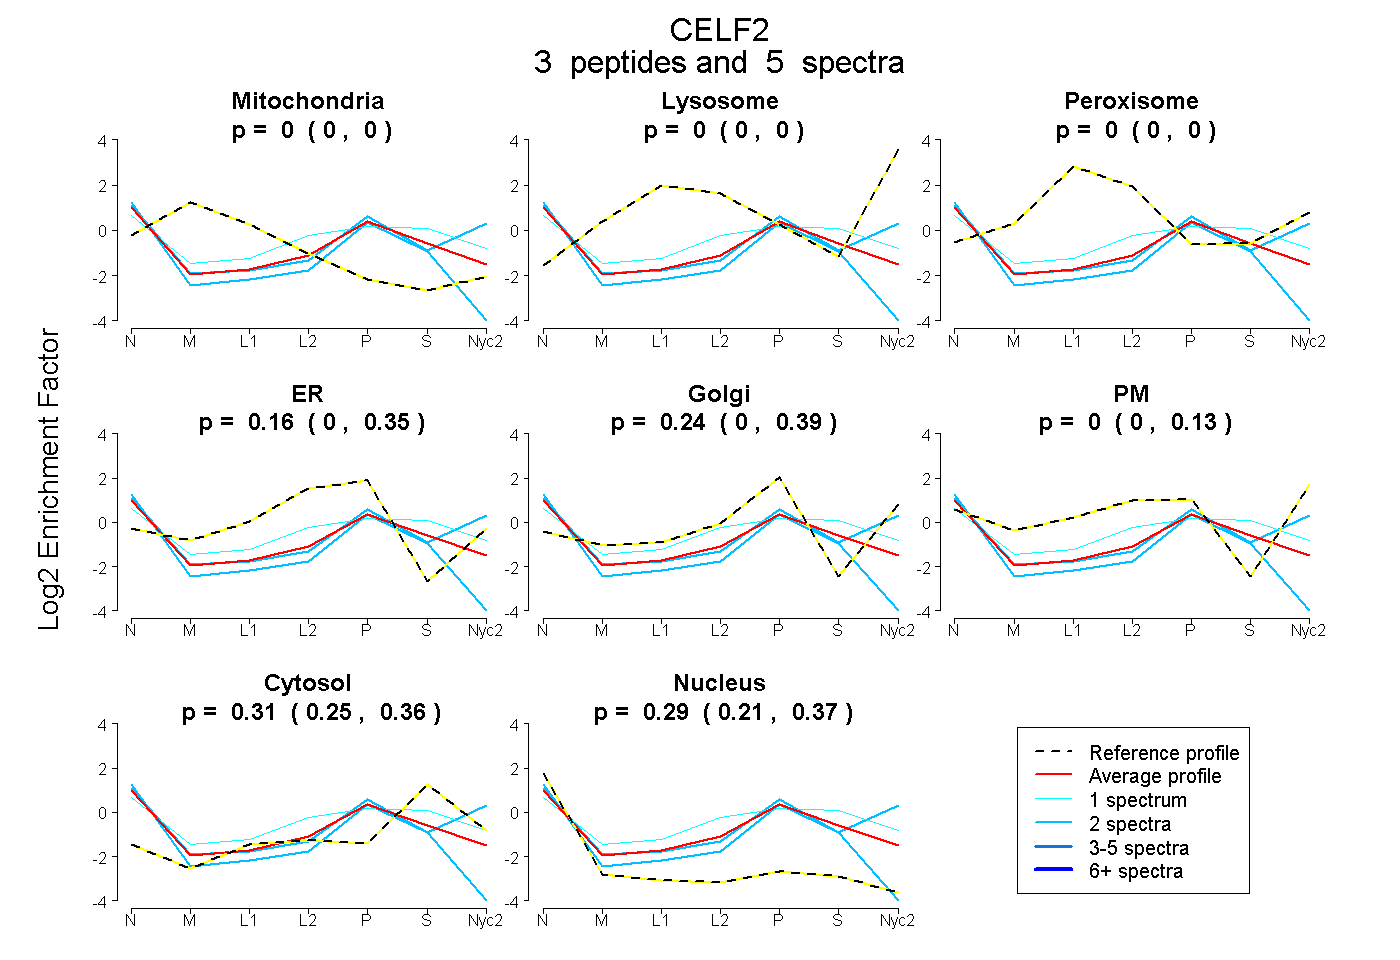
0.000 | 0.000
0.000 | 0.000
0.000 | 0.000
0.000 | 0.352
0.000 | 0.388
0.000 | 0.133
0.251 | 0.357
0.209 | 0.373
| Plot | Mito | Lyso | Perox | ER | Golgi | PM | Cytosol | Nucleus | |||||
| Expt A |
3 peptides |
5 spectra |
|
0.000 0.000 | 0.000 |
0.000 0.000 | 0.000 |
0.000 0.000 | 0.000 |
0.159 0.000 | 0.352 |
0.240 0.000 | 0.388 |
0.000 0.000 | 0.133 |
0.309 0.251 | 0.357 |
0.293 0.209 | 0.373 |
| 1 spectrum, SNAVEDR | 0.000 | 0.000 | 0.000 | 0.201 | 0.000 | 0.215 | 0.471 | 0.113 | ||
| 2 spectra, GCAFVTFSTR | 0.000 | 0.000 | 0.000 | 0.242 | 0.000 | 0.000 | 0.181 | 0.577 | ||
| 2 spectra, MFVGQIPR | 0.000 | 0.000 | 0.000 | 0.000 | 0.392 | 0.164 | 0.243 | 0.201 |