RALY
[ENSRNOP00000023429]
Main page
| | | Plot |
Mito |
Lyso |
|
Perox |
ER |
Golgi |
PM |
Cytosol |
Nucleus |
|
| Expt A |
 12
12
peptides |
27
spectra |
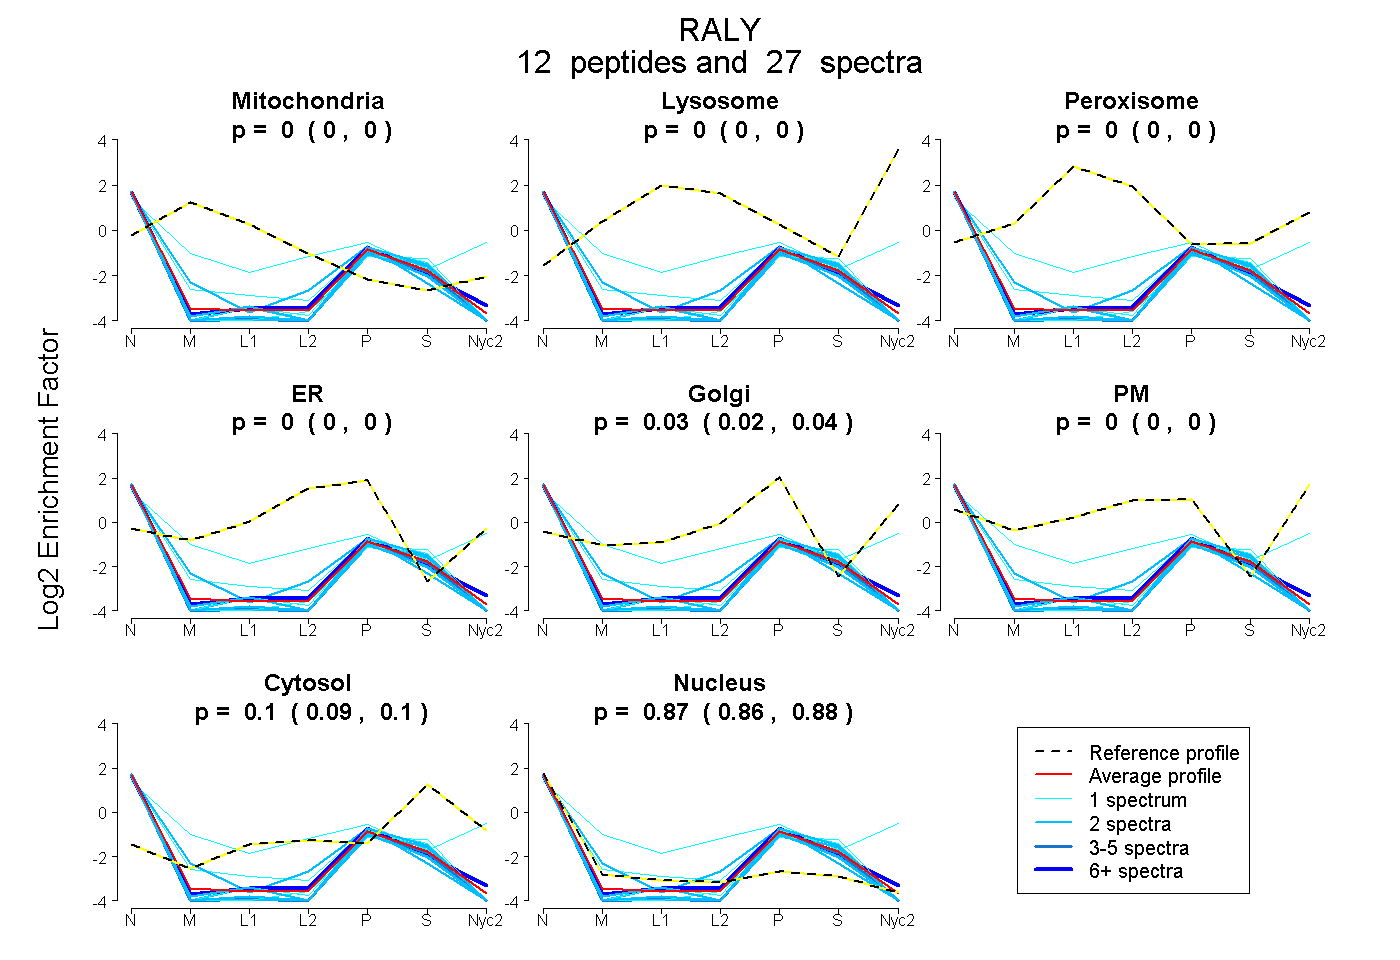 |
0.000
0.000 | 0.000 |
0.000
0.000 | 0.000 |
|
0.000
0.000 | 0.000 |
0.000
0.000 | 0.000 |
0.029
0.021 | 0.036 |
0.000
0.000 | 0.000 |
0.099
0.092 | 0.105 |
0.872
0.864 | 0.878 |
|
| | | Plot |
Mito |
|
Lyso or Perox |
|
ER |
Golgi |
PM |
Cytosol |
Nucleus |
|
| Expt B |
2
peptides |
3
spectra |
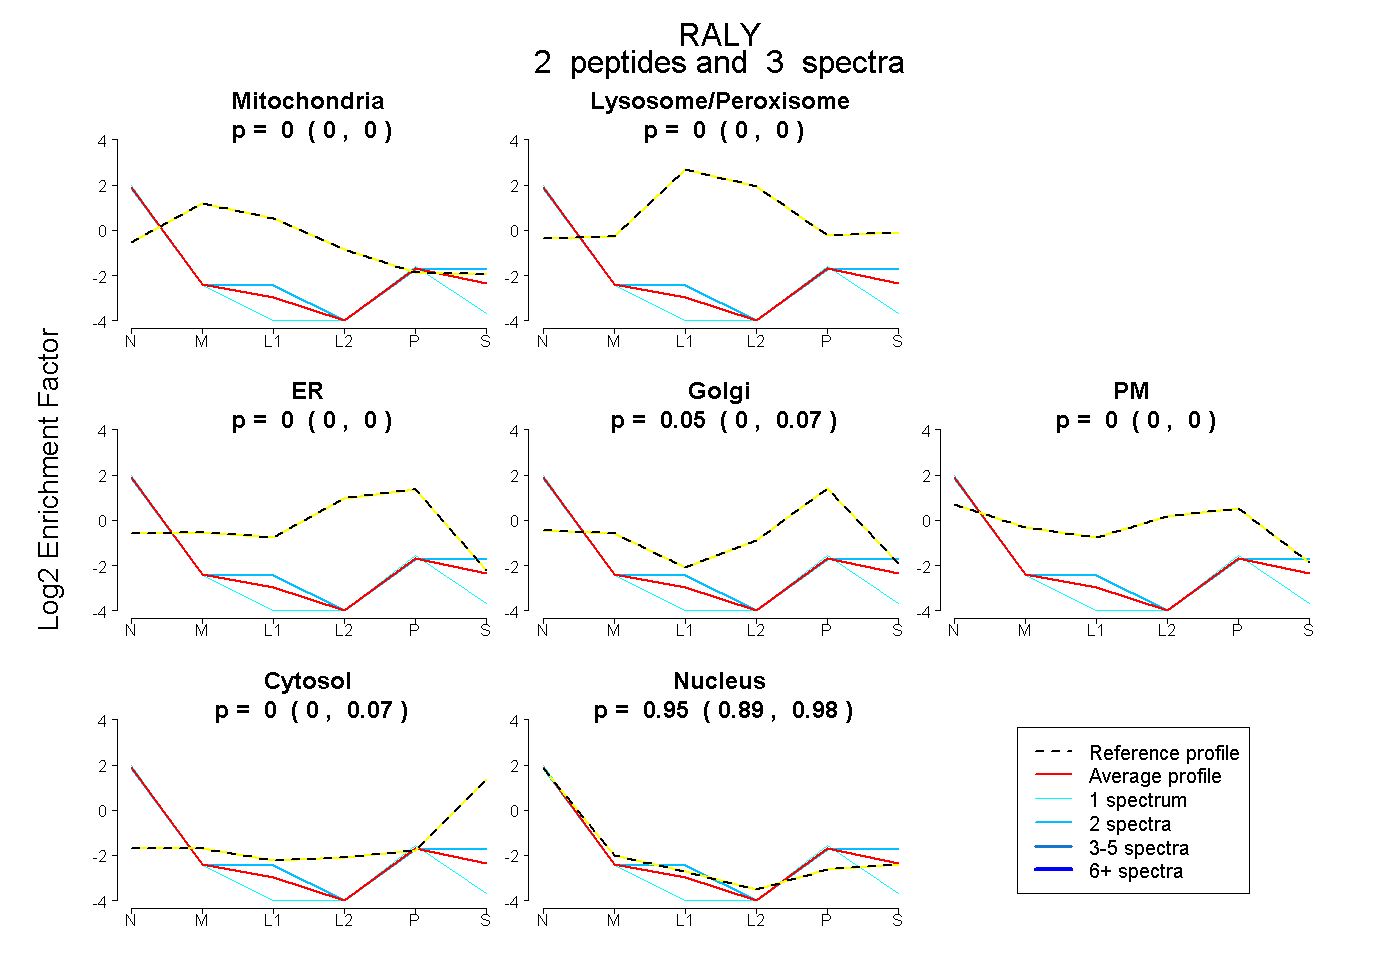 |
0.000
0.000 | 0.000 |
|
0.000
0.000 | 0.000 |
|
0.000
0.000 | 0.000 |
0.049
0.000 | 0.071 |
0.000
0.000 | 0.000 |
0.000
0.000 | 0.070 |
0.951
0.894 | 0.980 |
|
| 1 spectrum, AATAIYR |
0.000 |
|
0.000 |
|
0.000 |
0.014 |
0.000 |
0.000 |
0.986 |
|
| 2 spectra, AAVLGENGR |
0.000 |
|
0.000 |
|
0.000 |
0.026 |
0.000 |
0.070 |
0.904 |
|