 4
4peptides
spectra
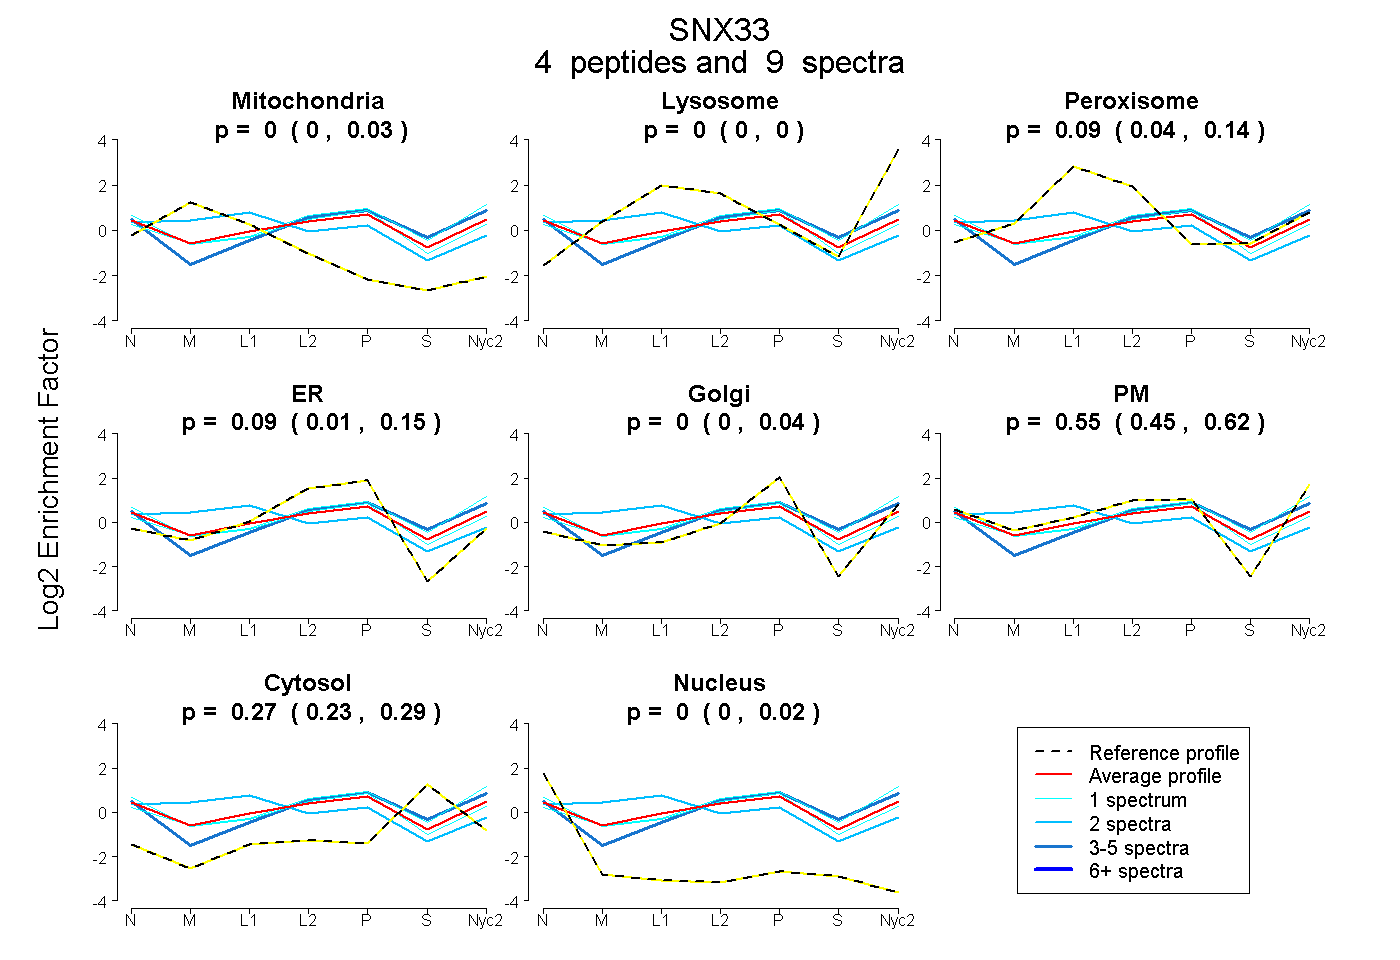
0.000 | 0.028
0.000 | 0.000
0.043 | 0.136
0.007 | 0.149
0.000 | 0.044
0.455 | 0.616
0.226 | 0.292
0.000 | 0.019
2peptides
spectra
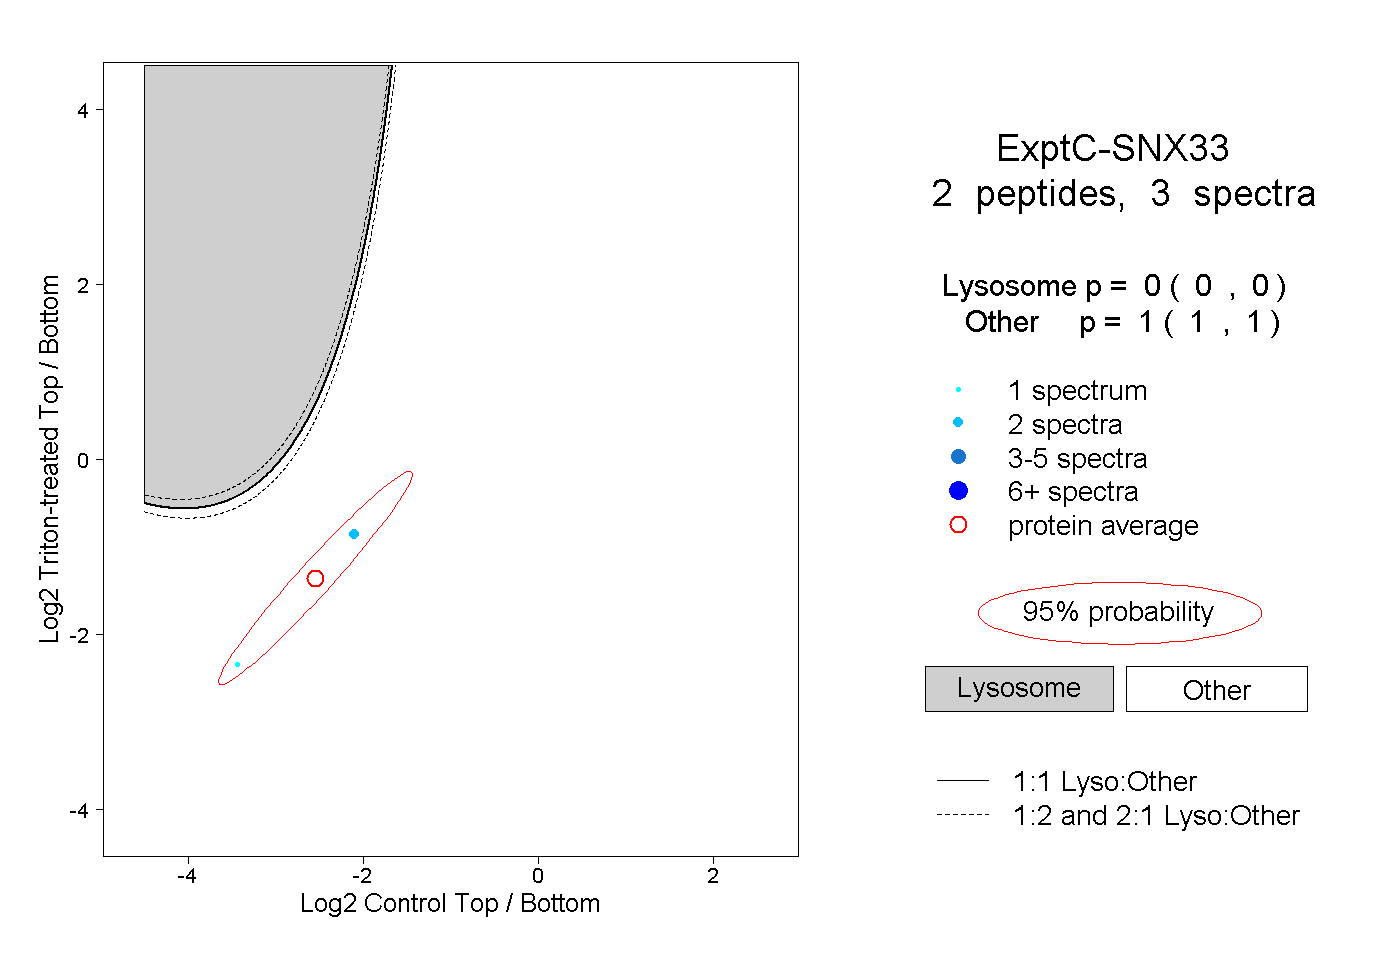
0.000 | 0.000
1.000 | 1.000
1peptide
spectrum
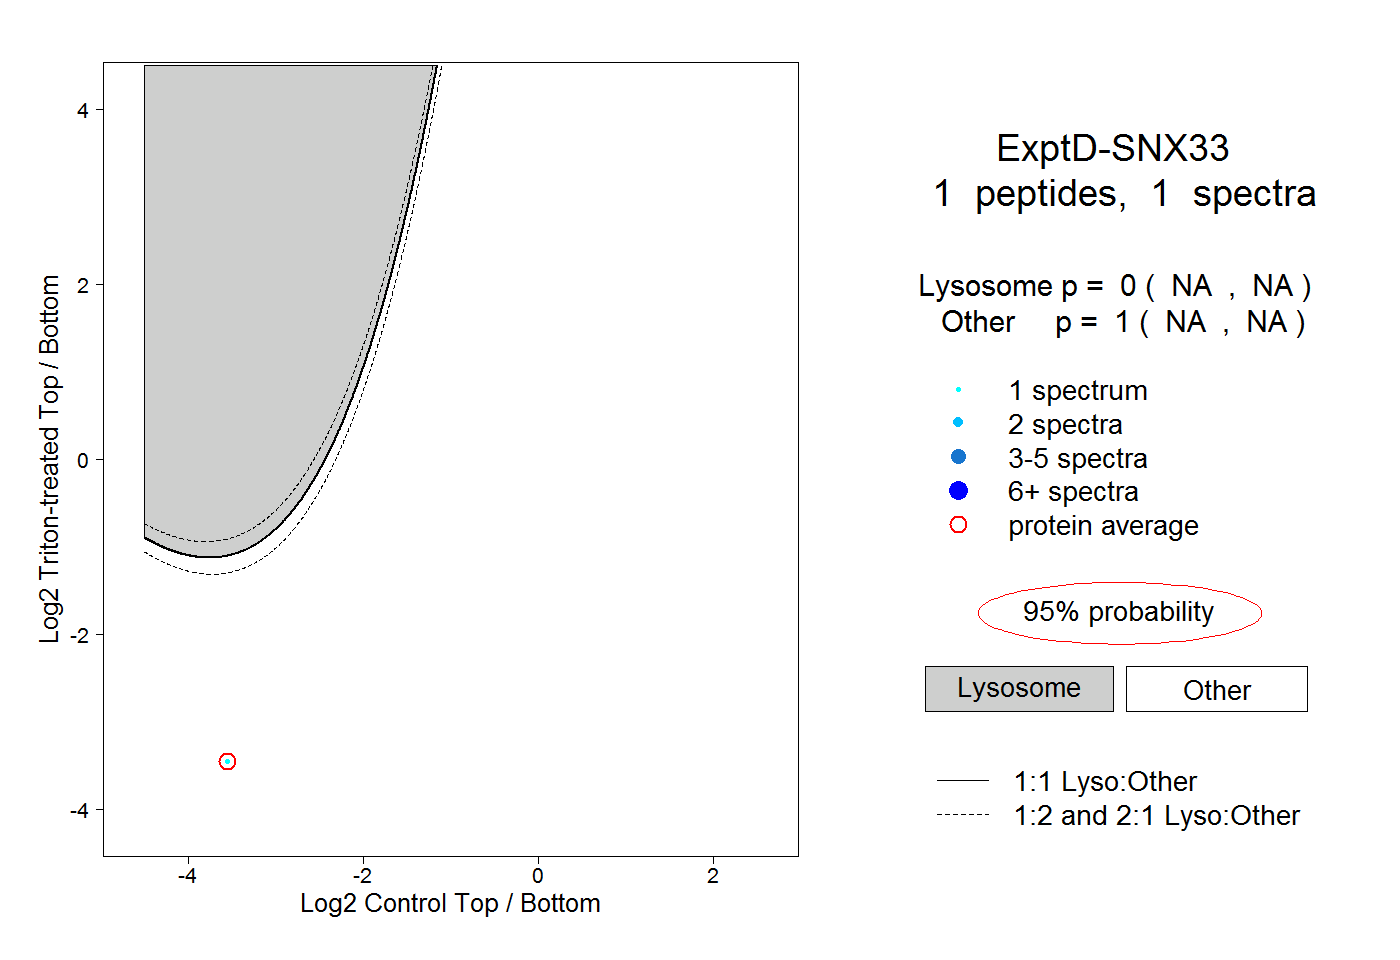
NA | NA
NA | NA