 4
4peptides
spectra
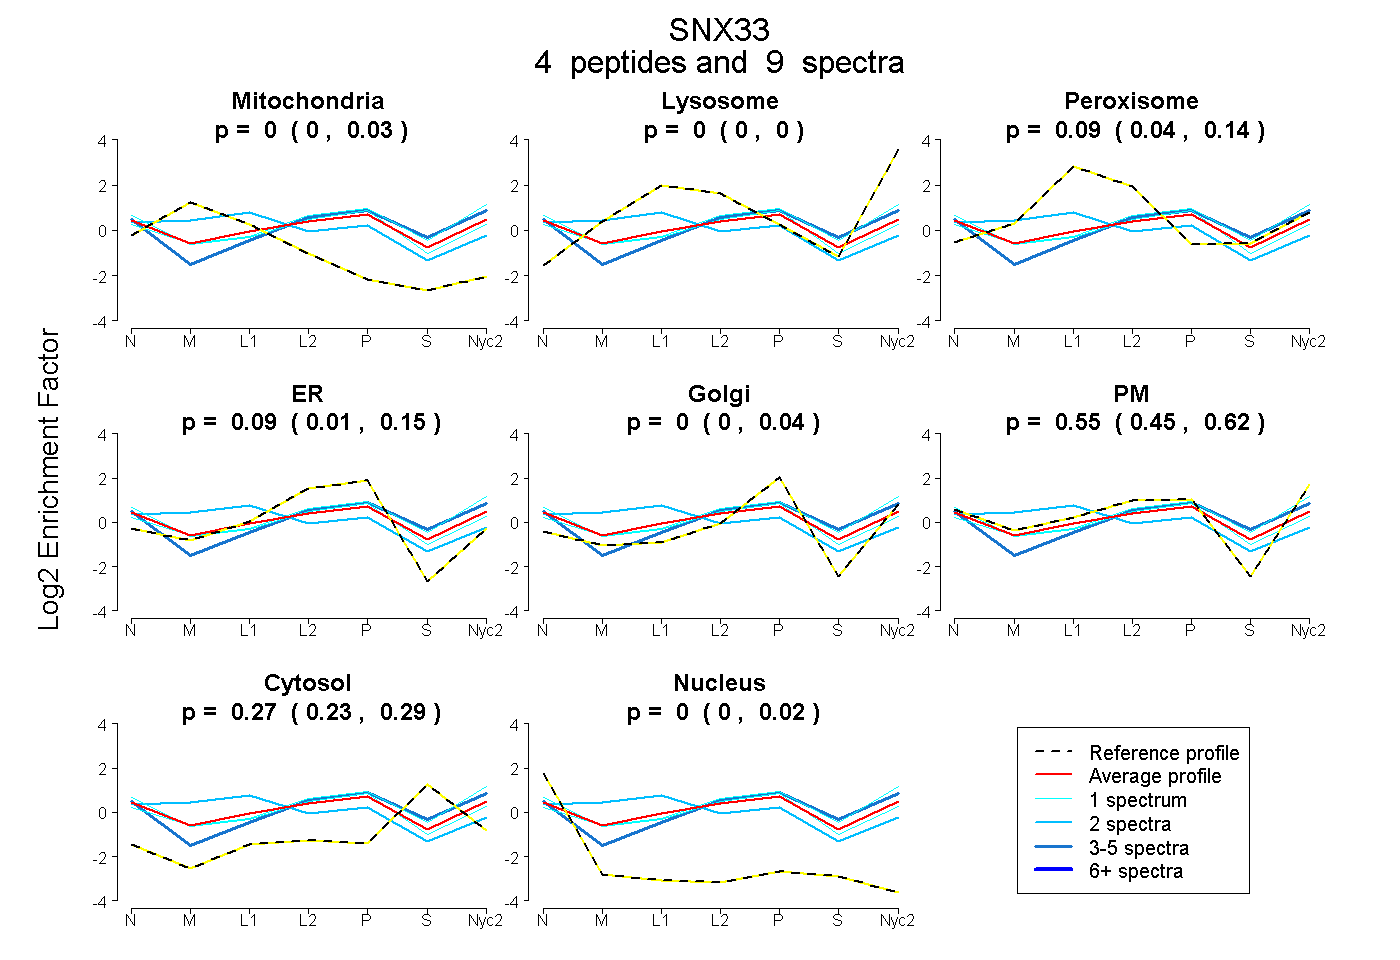
0.000 | 0.028
0.000 | 0.000
0.043 | 0.136
0.007 | 0.149
0.000 | 0.044
0.455 | 0.616
0.226 | 0.292
0.000 | 0.019
| Plot | Mito | Lyso | Perox | ER | Golgi | PM | Cytosol | Nucleus | |||||
| Expt A |
4 peptides |
9 spectra |
|
0.000 0.000 | 0.028 |
0.000 0.000 | 0.000 |
0.087 0.043 | 0.136 |
0.093 0.007 | 0.149 |
0.000 0.000 | 0.044 |
0.550 0.455 | 0.616 |
0.270 0.226 | 0.292 |
0.000 0.000 | 0.019 |
| 1 spectrum, HFDWLYNR | 0.000 | 0.060 | 0.037 | 0.000 | 0.027 | 0.612 | 0.264 | 0.000 | ||
| 1 spectrum, QQILFYQR | 0.000 | 0.000 | 0.034 | 0.196 | 0.000 | 0.512 | 0.221 | 0.036 | ||
| 2 spectra, LTPTHAGSPVYR | 0.281 | 0.000 | 0.329 | 0.000 | 0.280 | 0.079 | 0.002 | 0.029 | ||
| 5 spectra, FEEDFIEK | 0.000 | 0.000 | 0.000 | 0.029 | 0.000 | 0.621 | 0.350 | 0.000 |
| Plot | Lyso | Other | |||||||||||
| Expt C |
2 peptides |
3 spectra |
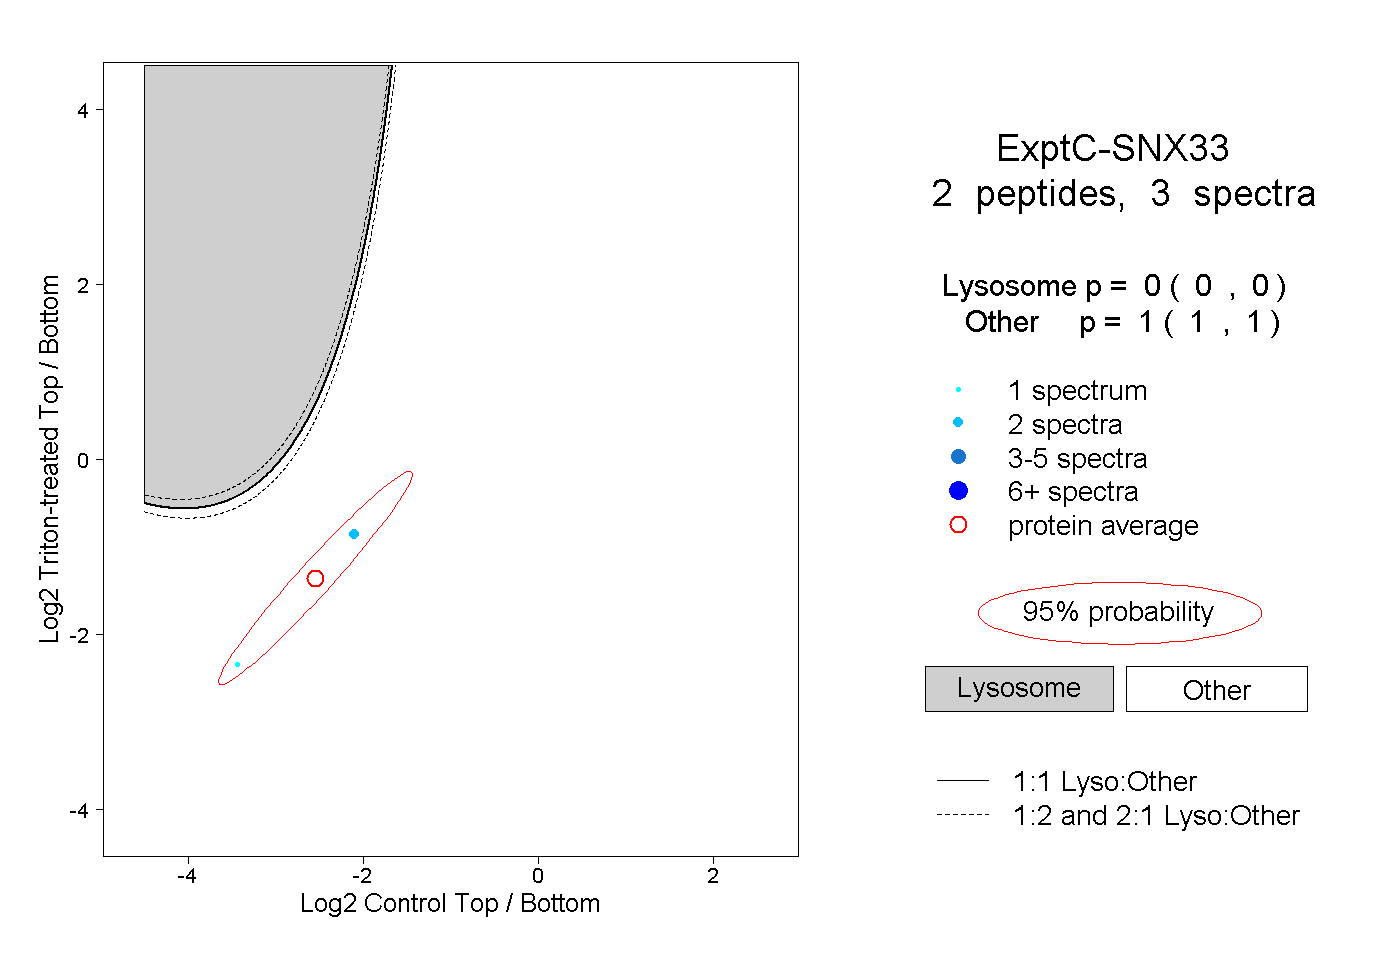 |
0.000 0.000 | 0.000 |
1.000 1.000 | 1.000 |
||||||||
| Plot | Lyso | Other | |||||||||||
| Expt D |
1 peptide |
1 spectrum |
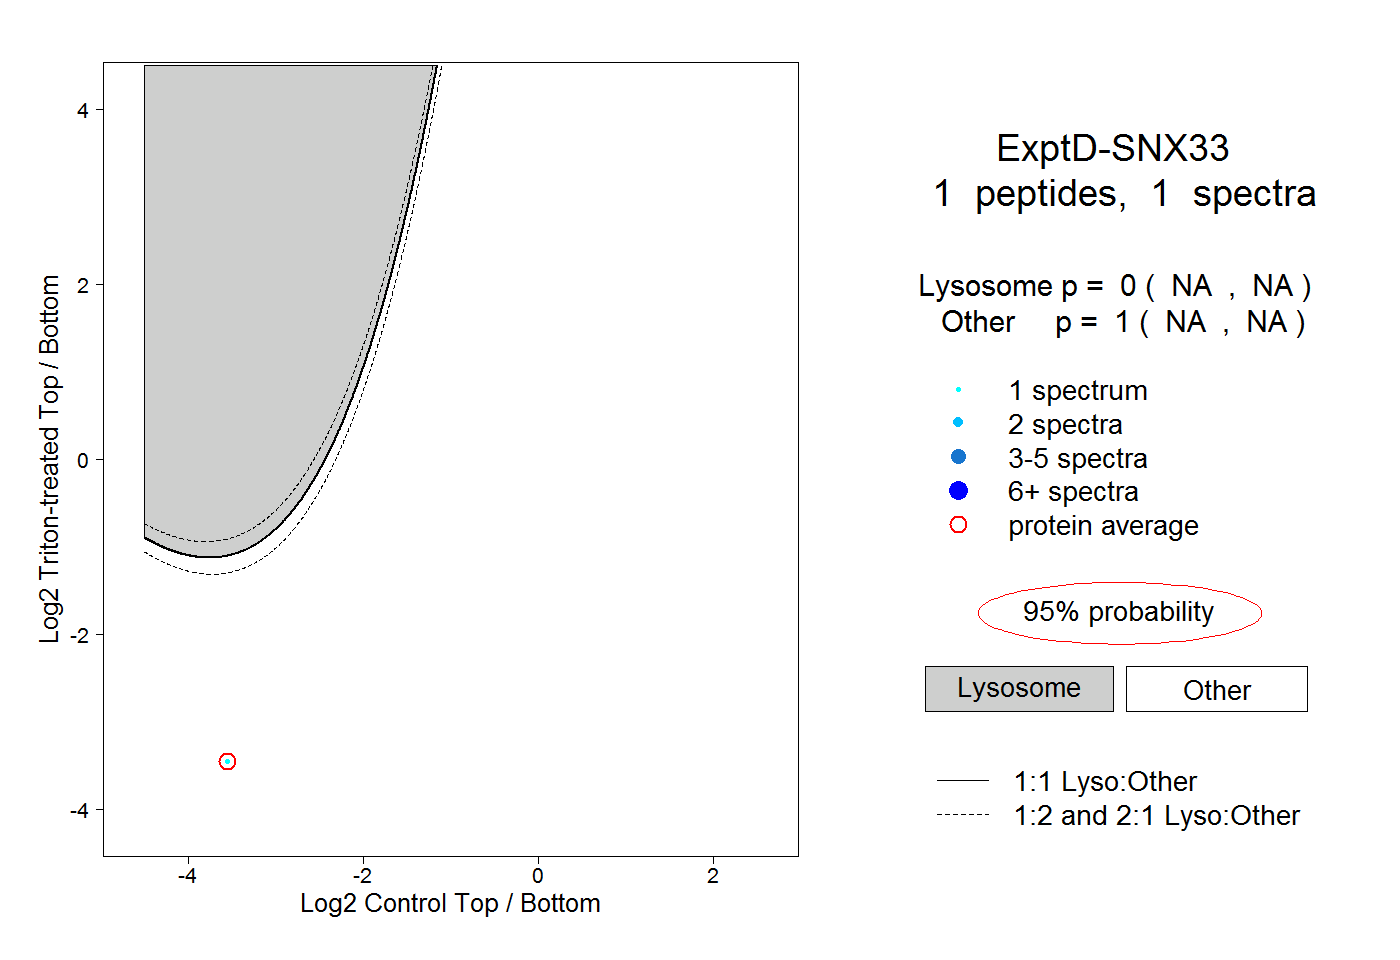 |
0.000 NA | NA |
1.000 NA | NA |