13
13peptides
spectra
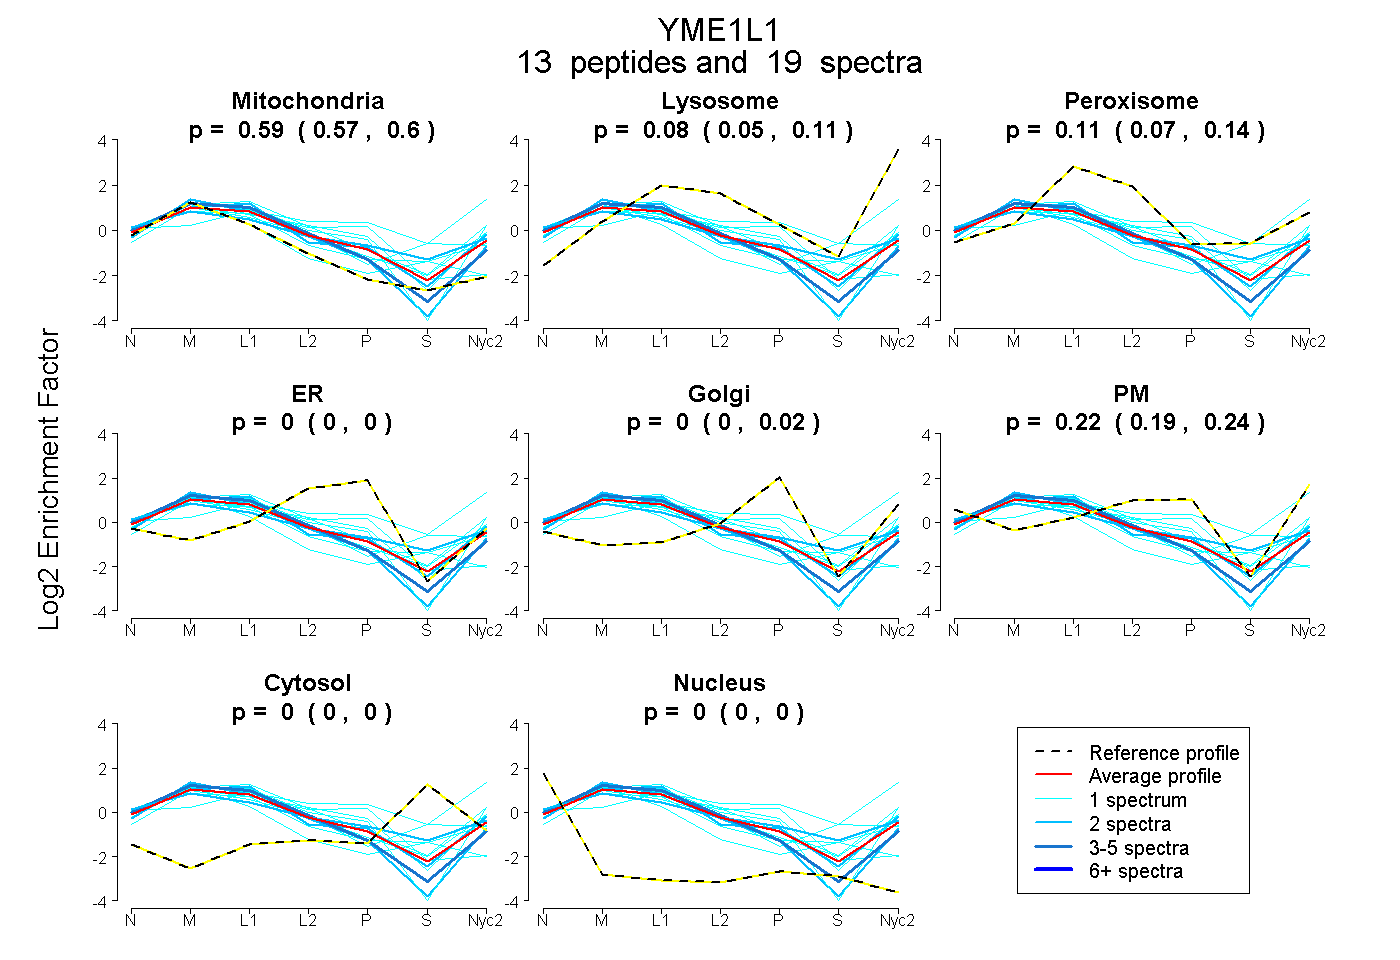
0.572 | 0.600
0.053 | 0.109
0.071 | 0.139
0.000 | 0.000
0.000 | 0.023
0.186 | 0.236
0.000 | 0.000
0.000 | 0.000
7peptides
spectra
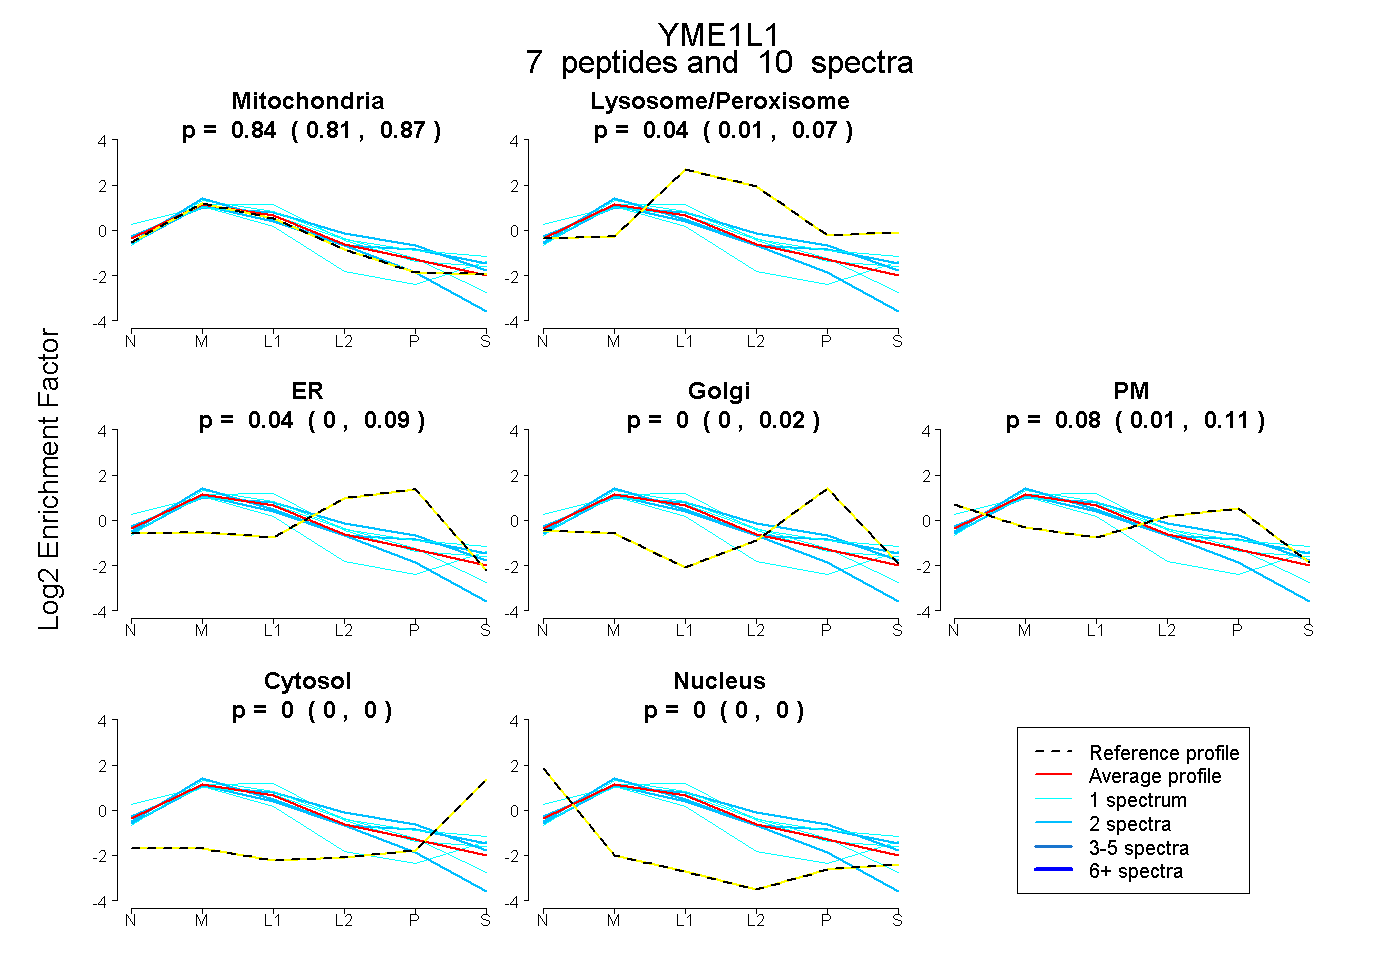
0.807 | 0.874
0.008 | 0.070
0.000 | 0.091
0.000 | 0.020
0.015 | 0.114
0.000 | 0.000
0.000 | 0.000