 13
13peptides
spectra
0.572 | 0.600
0.053 | 0.109
0.071 | 0.139
0.000 | 0.000
0.000 | 0.023
0.186 | 0.236
0.000 | 0.000
0.000 | 0.000
| Plot | Mito | Lyso | Perox | ER | Golgi | PM | Cytosol | Nucleus | |||||
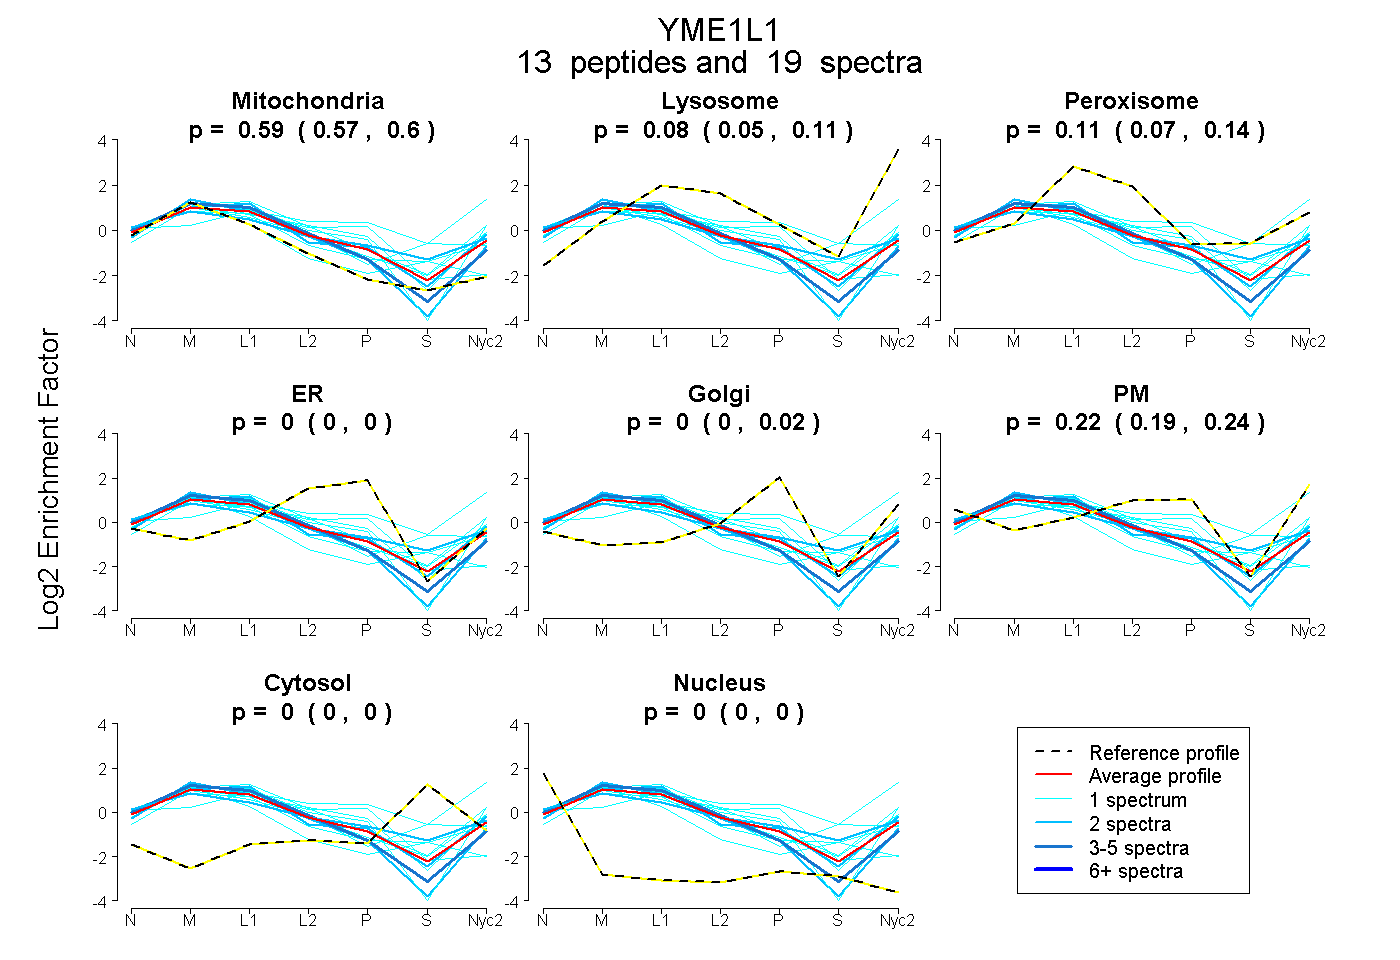
| Expt A |
13 peptides |
19 spectra |
|
0.588 0.572 | 0.600 |
0.085 0.053 | 0.109 |
0.105 0.071 | 0.139 |
0.000 0.000 | 0.000 |
0.000 0.000 | 0.023 |
0.222 0.186 | 0.236 |
0.000 0.000 | 0.000 |
0.000 0.000 | 0.000 |
| 2 spectra, GILLVGPPGTGK | 0.599 | 0.172 | 0.031 | 0.000 | 0.000 | 0.198 | 0.000 | 0.000 | ||
| 2 spectra, TTTGLDSAVDPVQMK | 0.446 | 0.000 | 0.186 | 0.000 | 0.000 | 0.263 | 0.104 | 0.000 | ||
| 1 spectrum, NIPEAHQDAFK | 0.605 | 0.097 | 0.152 | 0.000 | 0.000 | 0.055 | 0.090 | 0.000 | ||
| 1 spectrum, ANAPCVIFIDELDSVGGK | 0.469 | 0.036 | 0.308 | 0.000 | 0.000 | 0.000 | 0.186 | 0.000 | ||
| 1 spectrum, LAEAQNIAPSFVK | 0.489 | 0.051 | 0.000 | 0.000 | 0.000 | 0.460 | 0.000 | 0.000 | ||
| 1 spectrum, AAVDGK | 0.032 | 0.162 | 0.247 | 0.000 | 0.000 | 0.396 | 0.163 | 0.000 | ||
| 1 spectrum, ELEFSK | 0.824 | 0.000 | 0.029 | 0.000 | 0.000 | 0.000 | 0.147 | 0.000 | ||
| 2 spectra, ILMGPER | 0.729 | 0.077 | 0.000 | 0.000 | 0.000 | 0.194 | 0.000 | 0.000 | ||
| 1 spectrum, EIQIVLEGK | 0.544 | 0.000 | 0.050 | 0.405 | 0.000 | 0.000 | 0.000 | 0.000 | ||
| 1 spectrum, ATIMPR | 0.491 | 0.230 | 0.173 | 0.000 | 0.000 | 0.106 | 0.000 | 0.000 | ||
| 4 spectra, SVDPEIIAR | 0.694 | 0.031 | 0.084 | 0.000 | 0.000 | 0.192 | 0.000 | 0.000 | ||
| 1 spectrum, EMVTMK | 0.619 | 0.251 | 0.055 | 0.000 | 0.000 | 0.076 | 0.000 | 0.000 | ||
| 1 spectrum, FTVLGGK | 0.475 | 0.095 | 0.029 | 0.074 | 0.000 | 0.327 | 0.000 | 0.000 |
| Plot | Mito | Lyso or Perox | ER | Golgi | PM | Cytosol | Nucleus | ||||||
| Expt B |
7 peptides |
10 spectra |
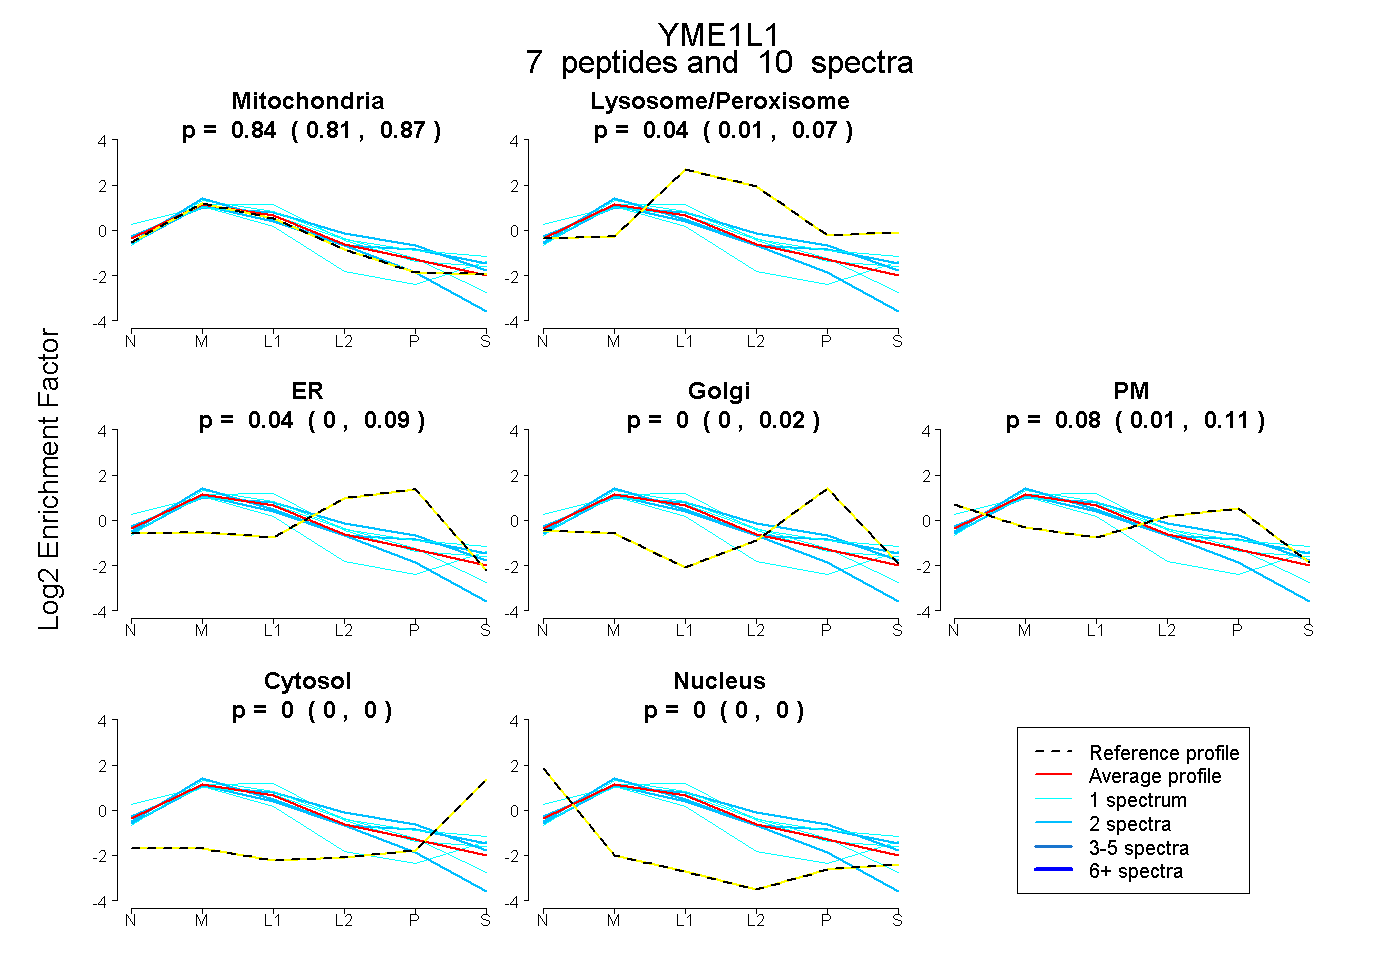 |
0.844 0.807 | 0.874 |
0.042 0.008 | 0.070 |
0.035 0.000 | 0.091 |
0.000 0.000 | 0.020 |
0.078 0.015 | 0.114 |
0.000 0.000 | 0.000 |
0.000 0.000 | 0.000 |
|||
| Plot | Lyso | Other | |||||||||||
| Expt C |
25 peptides |
127 spectra |
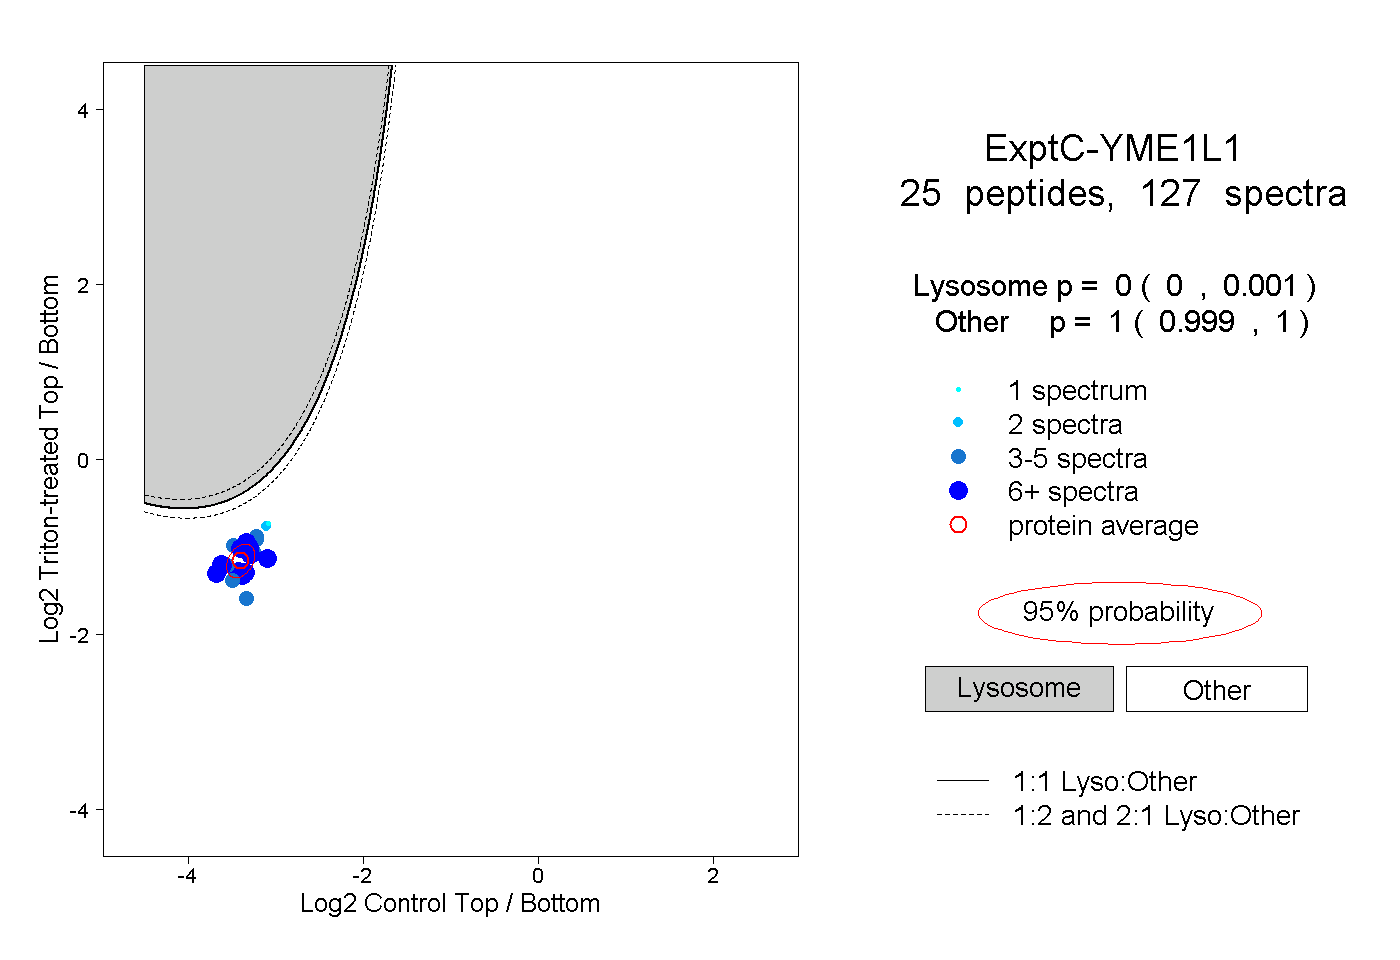 |
0.000 0.000 | 0.001 |
1.000 0.999 | 1.000 |
||||||||
| Plot | Lyso | Other | |||||||||||
| Expt D |
8 peptides |
14 spectra |
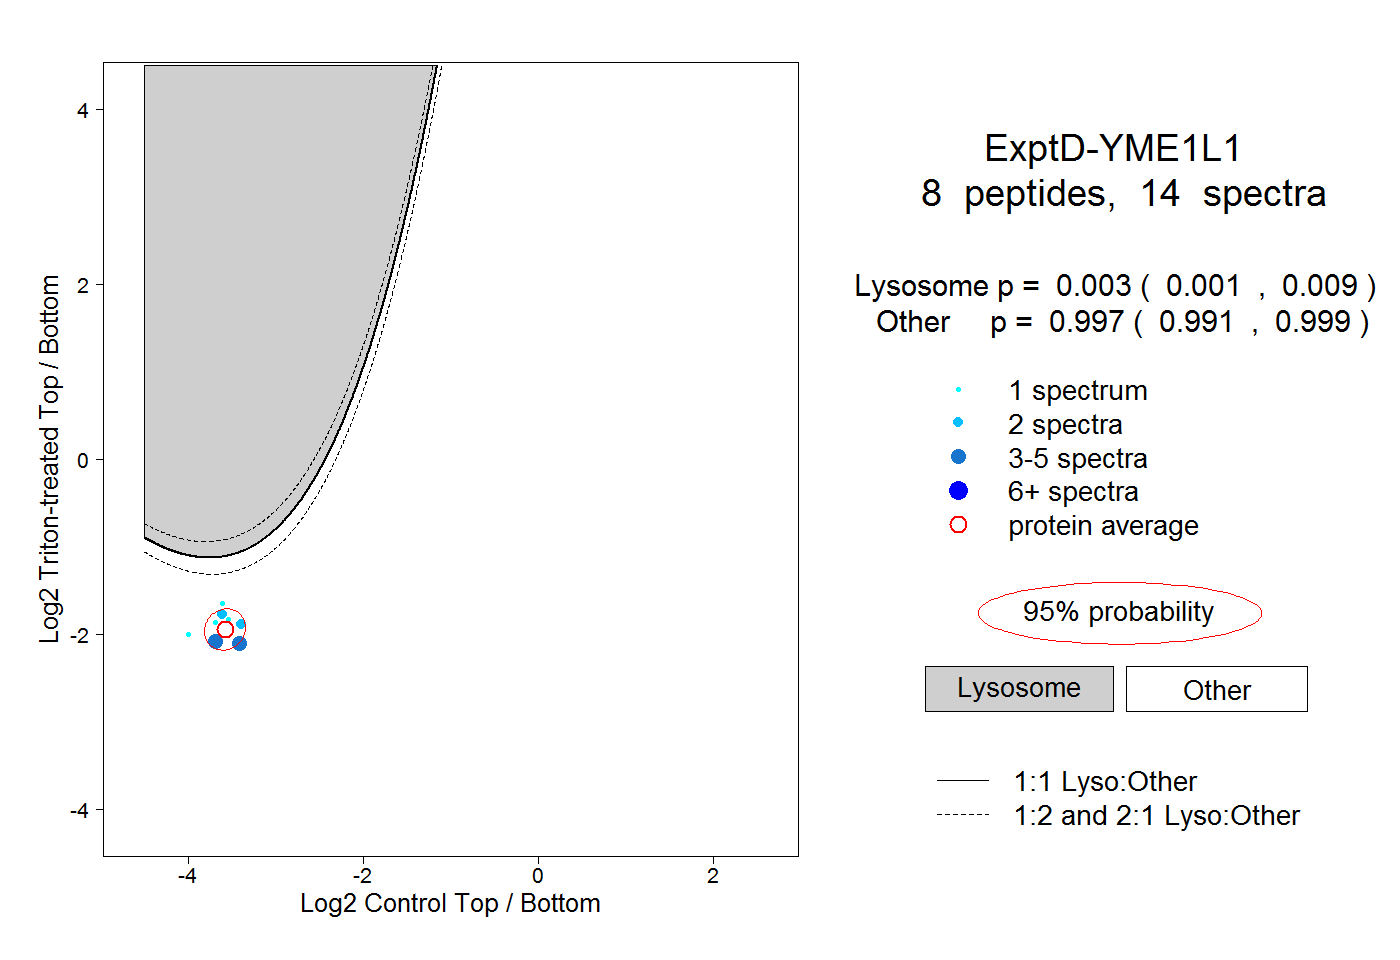 |
0.003 0.001 | 0.009 |
0.997 0.991 | 0.999 |