16
16peptides
spectra

0.000 | 0.003
0.000 | 0.000
0.704 | 0.710
0.000 | 0.000
0.000 | 0.000
0.000 | 0.000
0.289 | 0.293
0.000 | 0.000
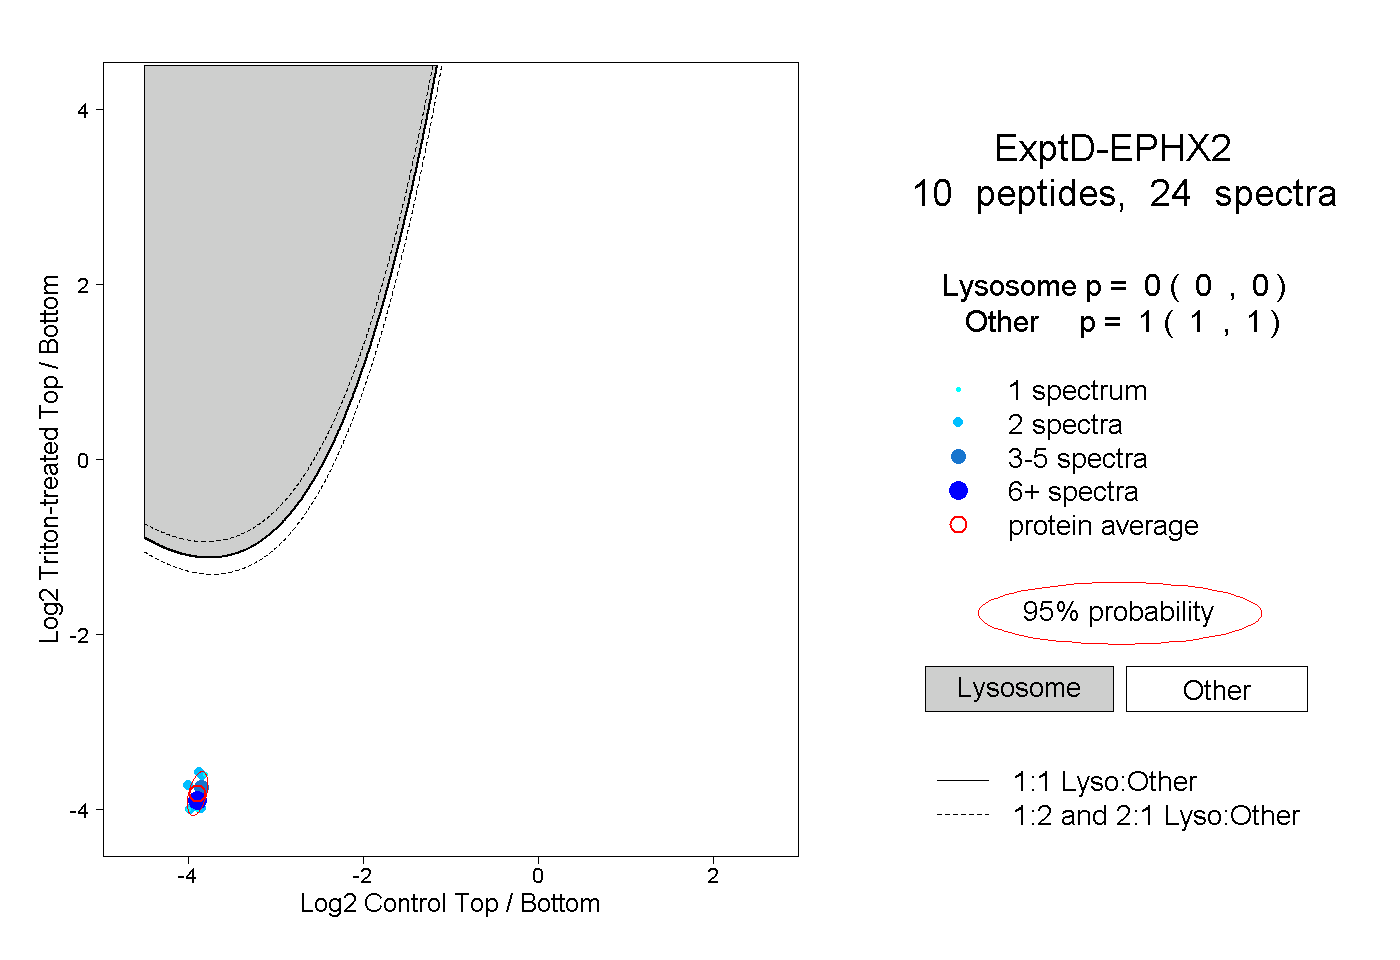
10peptides
spectra
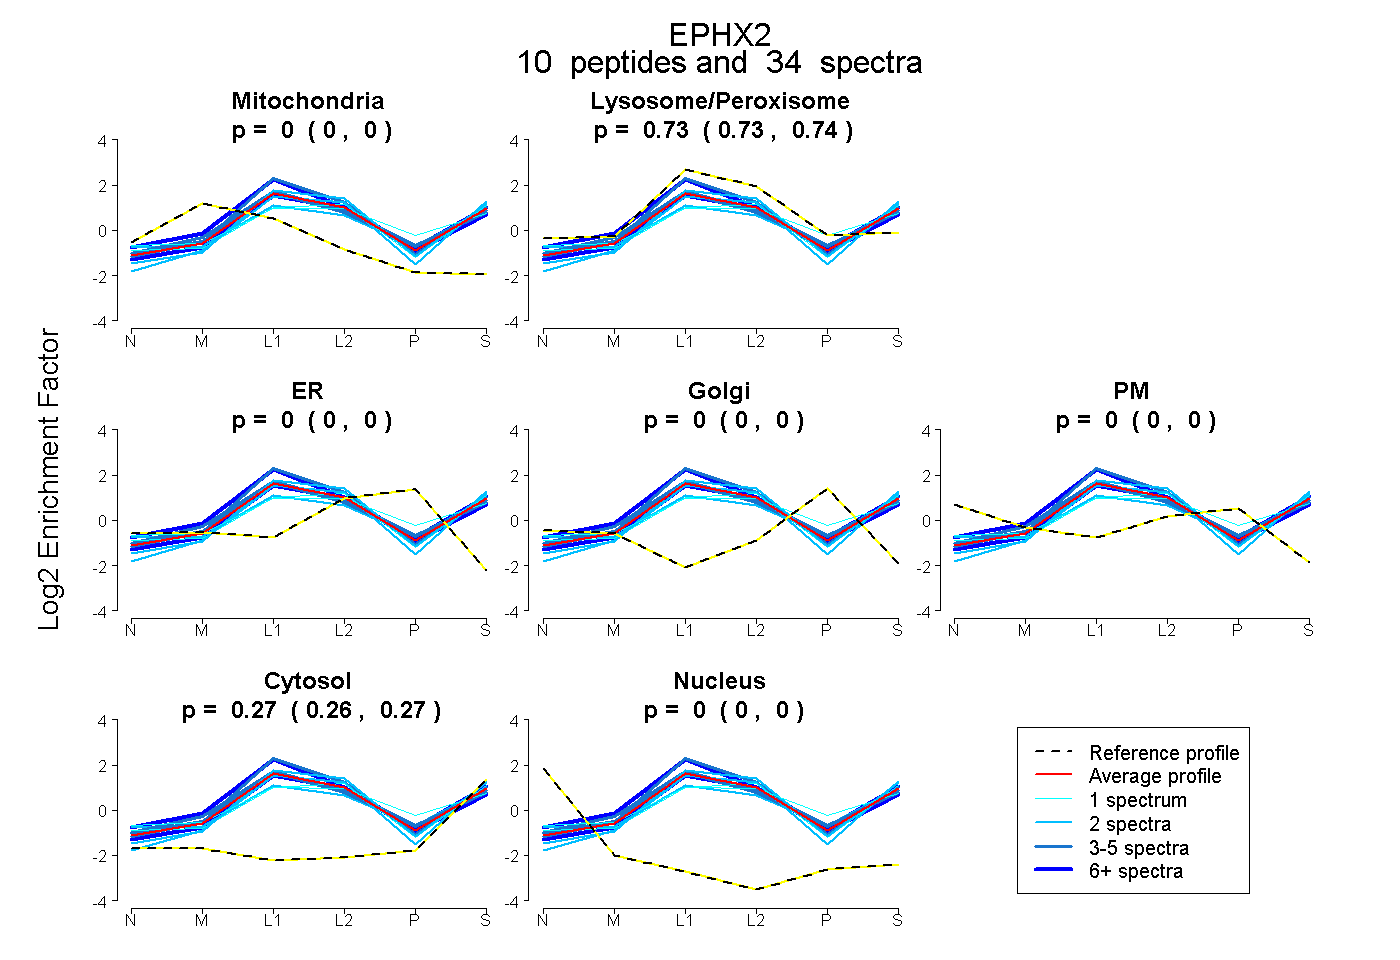
0.000 | 0.000
0.726 | 0.736
0.000 | 0.000
0.000 | 0.000
0.000 | 0.000
0.263 | 0.273
0.000 | 0.000