 17
17peptides
spectra
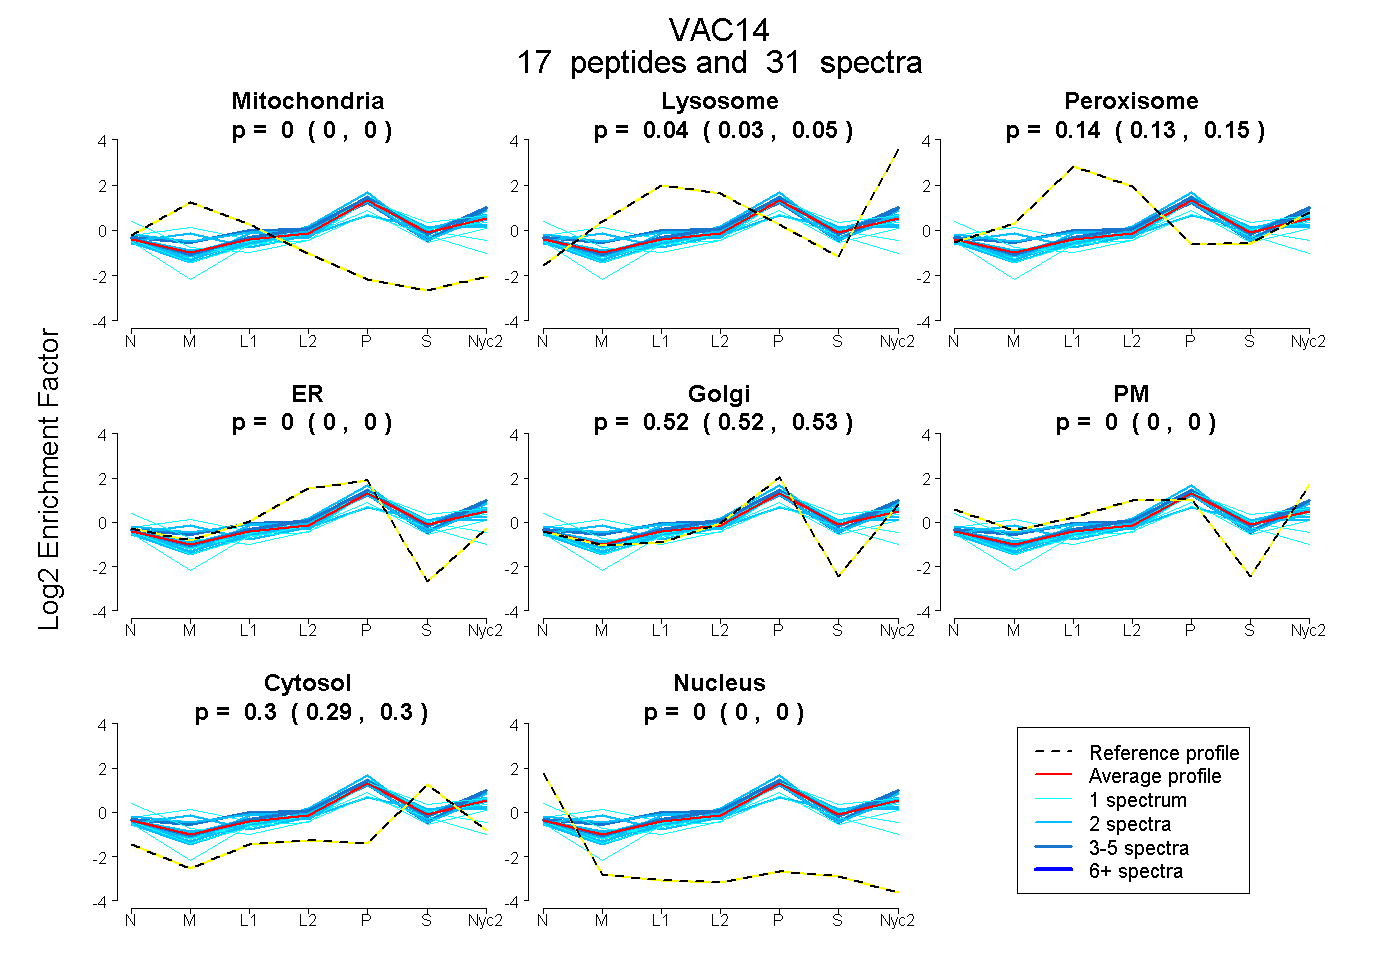
0.000 | 0.000
0.029 | 0.051
0.127 | 0.145
0.000 | 0.000
0.517 | 0.528
0.000 | 0.000
0.294 | 0.302
0.000 | 0.000
6peptides
spectra
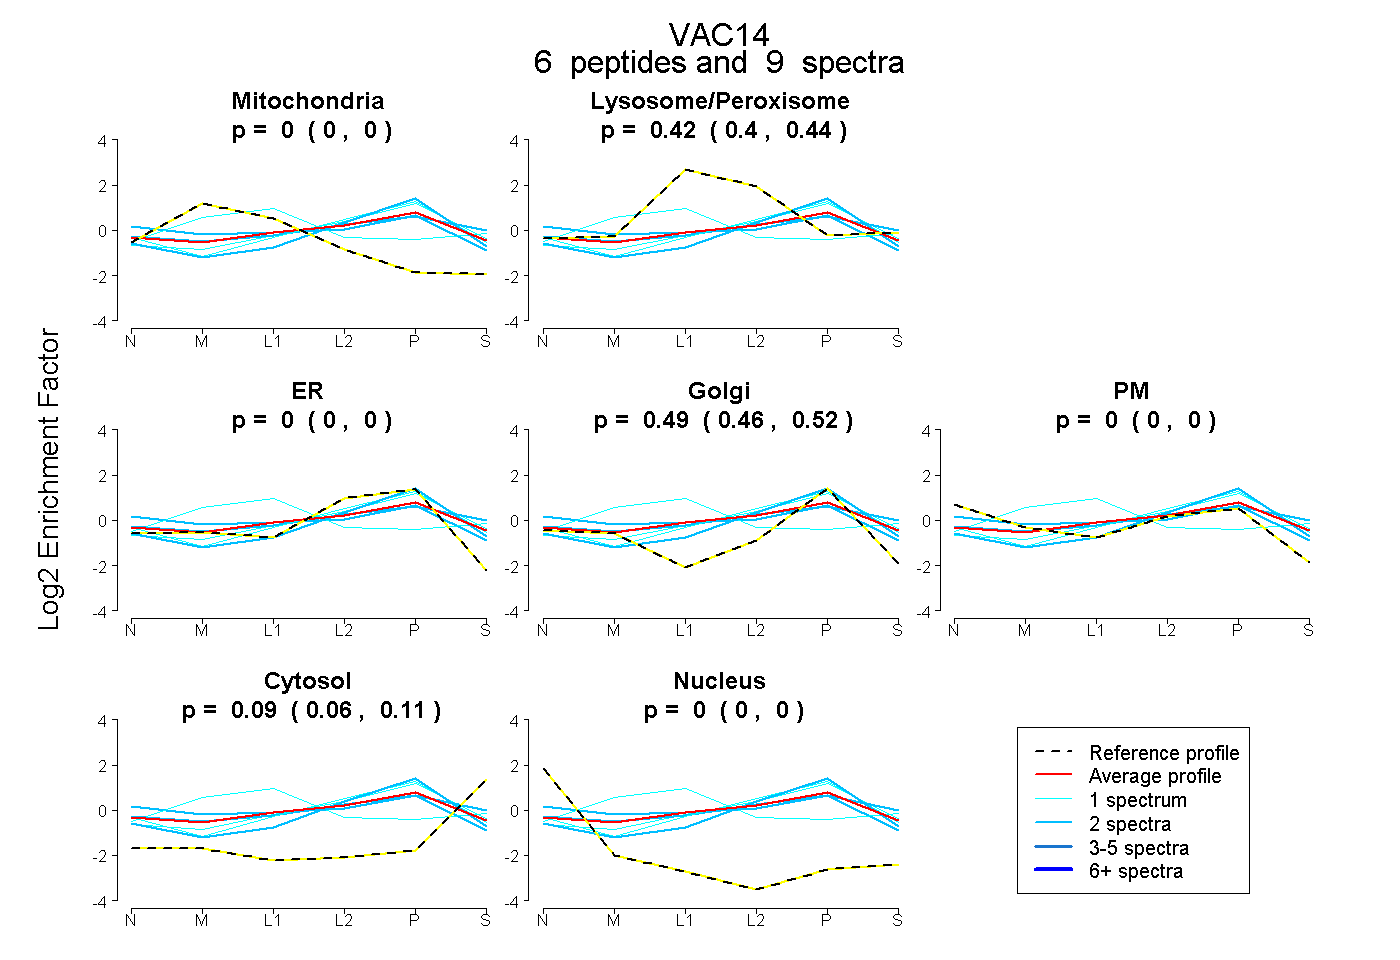
0.000 | 0.000
0.401 | 0.442
0.000 | 0.000
0.456 | 0.516
0.000 | 0.000
0.060 | 0.109
0.000 | 0.000
16peptides
spectra
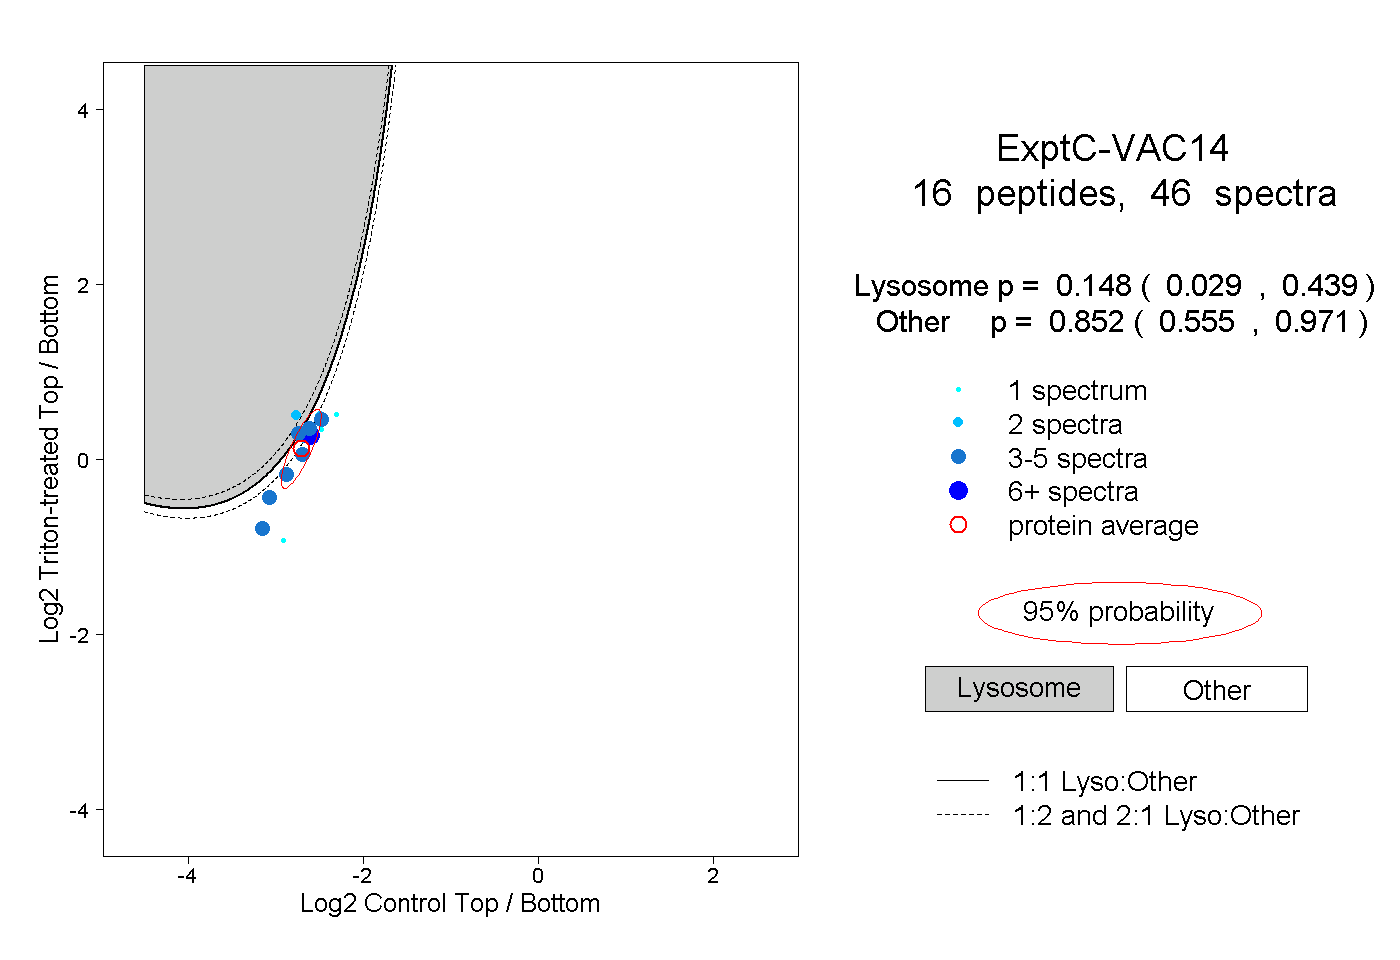
0.029 | 0.439
0.555 | 0.971
6peptides
spectra
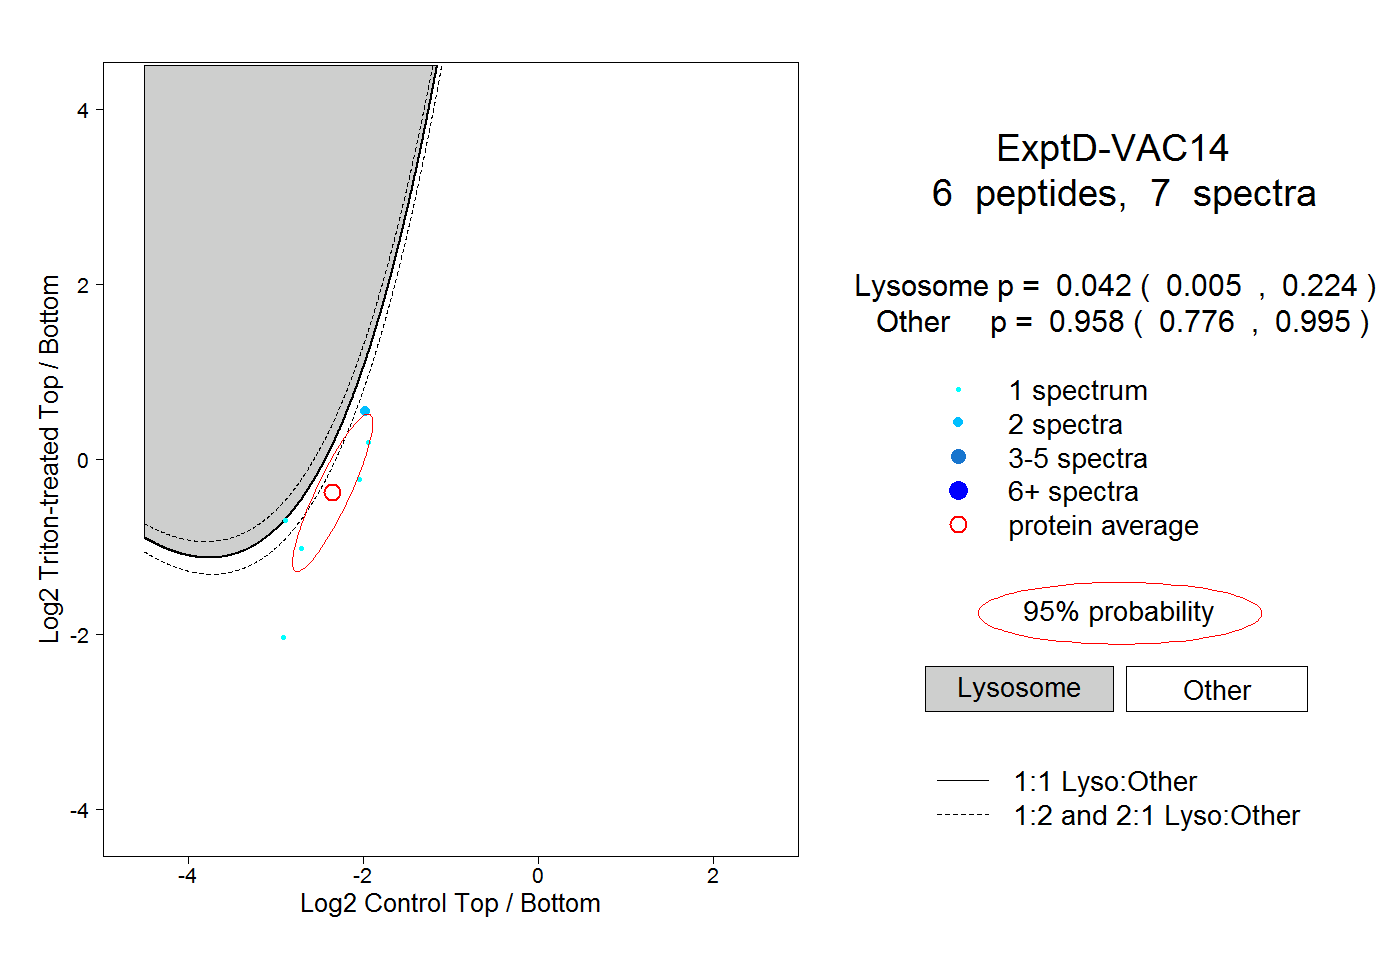
0.005 | 0.224
0.776 | 0.995