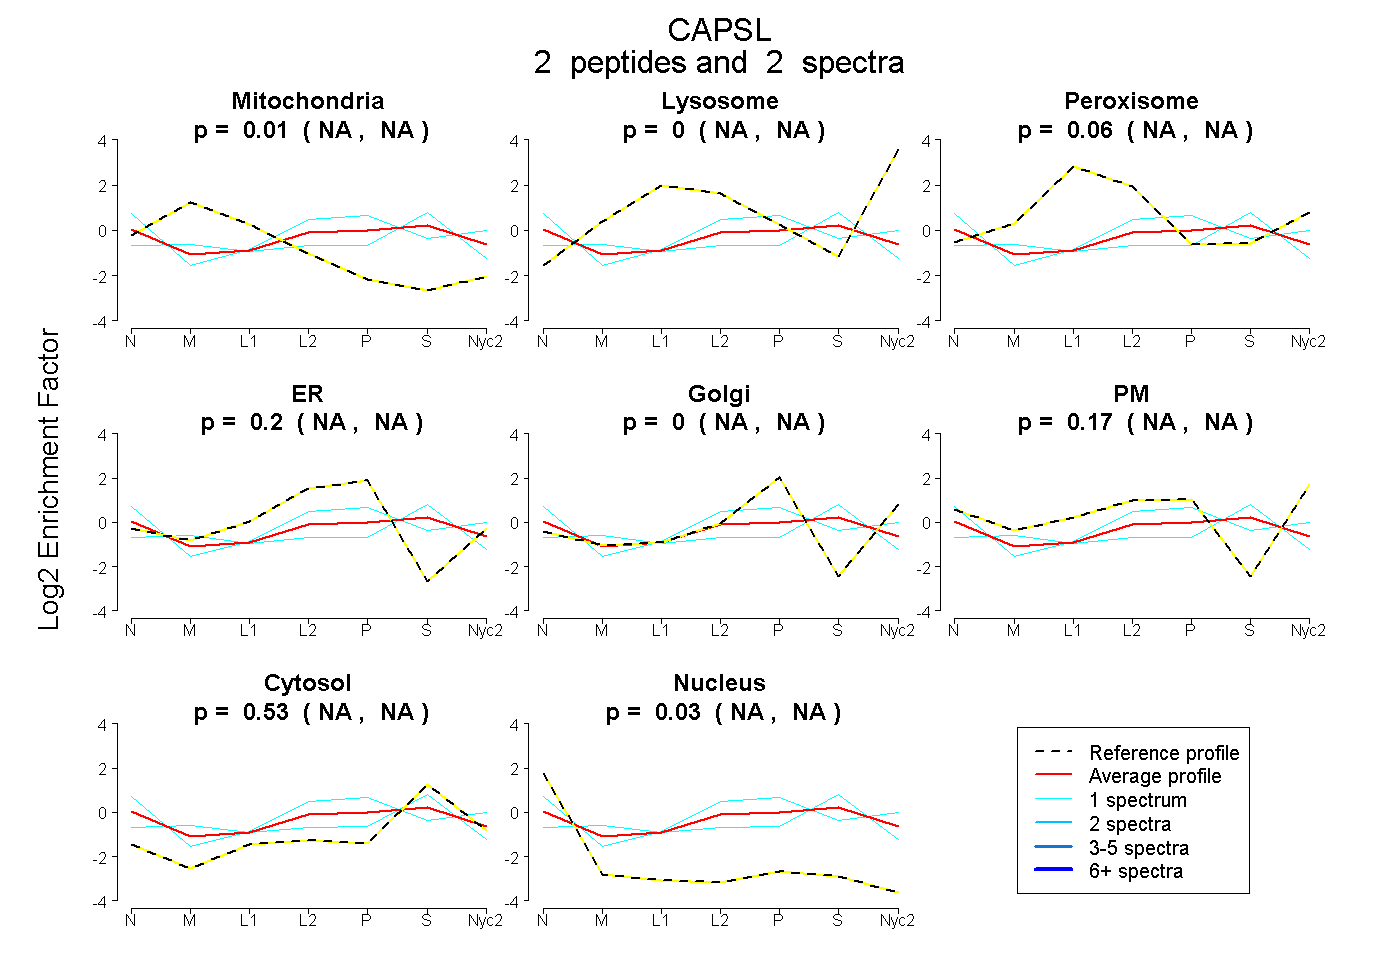
 2
2peptides
spectra
NA | NA
NA | NA
NA | NA
NA | NA
NA | NA
NA | NA
NA | NA
NA | NA
| Plot | Mito | Lyso | Perox | ER | Golgi | PM | Cytosol | Nucleus | |||||
| Expt A |
2 peptides |
2 spectra |
|
0.013 NA | NA |
0.000 NA | NA |
0.059 NA | NA |
0.200 NA | NA |
0.000 NA | NA |
0.167 NA | NA |
0.527 NA | NA |
0.034 NA | NA |
| 1 spectrum, GSAGIK | 0.000 | 0.000 | 0.000 | 0.213 | 0.000 | 0.378 | 0.379 | 0.030 | ||
| 1 spectrum, MAGTAR | 0.191 | 0.000 | 0.080 | 0.089 | 0.000 | 0.000 | 0.640 | 0.000 |