| 1 spectrum, ESLDDLTNLVVK |
0.349 |
|
0.140 |
|
0.000 |
0.000 |
0.000 |
0.510 |
0.000 |
|
| 3 spectra, AFIPQLLSR |
0.000 |
|
0.448 |
|
0.000 |
0.000 |
0.000 |
0.552 |
0.000 |
|
| 6 spectra, VEAFLITMEK |
0.000 |
|
0.360 |
|
0.000 |
0.000 |
0.000 |
0.640 |
0.000 |
|
| 3 spectra, LRPENVR |
0.000 |
|
0.547 |
|
0.000 |
0.080 |
0.000 |
0.373 |
0.000 |
|
| 1 spectrum, EQLGYIVFSGPR |
0.000 |
|
0.405 |
|
0.000 |
0.000 |
0.000 |
0.595 |
0.000 |
|
| 1 spectrum, LHIEALLHGNITK |
0.000 |
|
0.477 |
|
0.000 |
0.000 |
0.000 |
0.523 |
0.000 |
|
| 1 spectrum, QEAIPEDVIQK |
0.000 |
|
0.409 |
|
0.000 |
0.000 |
0.000 |
0.591 |
0.000 |
|
| 6 spectra, HIQALAIR |
0.000 |
|
0.425 |
|
0.000 |
0.000 |
0.000 |
0.575 |
0.000 |
|
| 2 spectra, EVQLPDR |
0.000 |
|
0.390 |
|
0.000 |
0.000 |
0.000 |
0.610 |
0.000 |
|
| 1 spectrum, AEGPQEWVFQECK |
0.000 |
|
0.371 |
|
0.000 |
0.000 |
0.000 |
0.629 |
0.000 |
|
| 1 spectrum, EALDDVTLPR |
0.000 |
|
0.333 |
|
0.000 |
0.000 |
0.000 |
0.667 |
0.000 |
|
| 1 spectrum, NVPLPEFPEHPFQEEHLK |
0.092 |
|
0.479 |
|
0.000 |
0.040 |
0.000 |
0.390 |
0.000 |
|
| 2 spectra, ANGIQGLR |
0.000 |
|
0.465 |
|
0.000 |
0.087 |
0.000 |
0.448 |
0.000 |
|
| 1 spectrum, DATPYPALIK |
0.000 |
|
0.348 |
|
0.099 |
0.000 |
0.000 |
0.552 |
0.000 |
|
| 1 spectrum, LFQLEK |
0.000 |
|
0.441 |
|
0.000 |
0.000 |
0.000 |
0.559 |
0.000 |
|
| 3 spectra, YTLETRPNQEGIDVR |
0.000 |
|
0.371 |
|
0.000 |
0.000 |
0.015 |
0.614 |
0.000 |
|
| 1 spectrum, LFSEVENK |
0.000 |
|
0.488 |
|
0.000 |
0.000 |
0.000 |
0.512 |
0.000 |
|
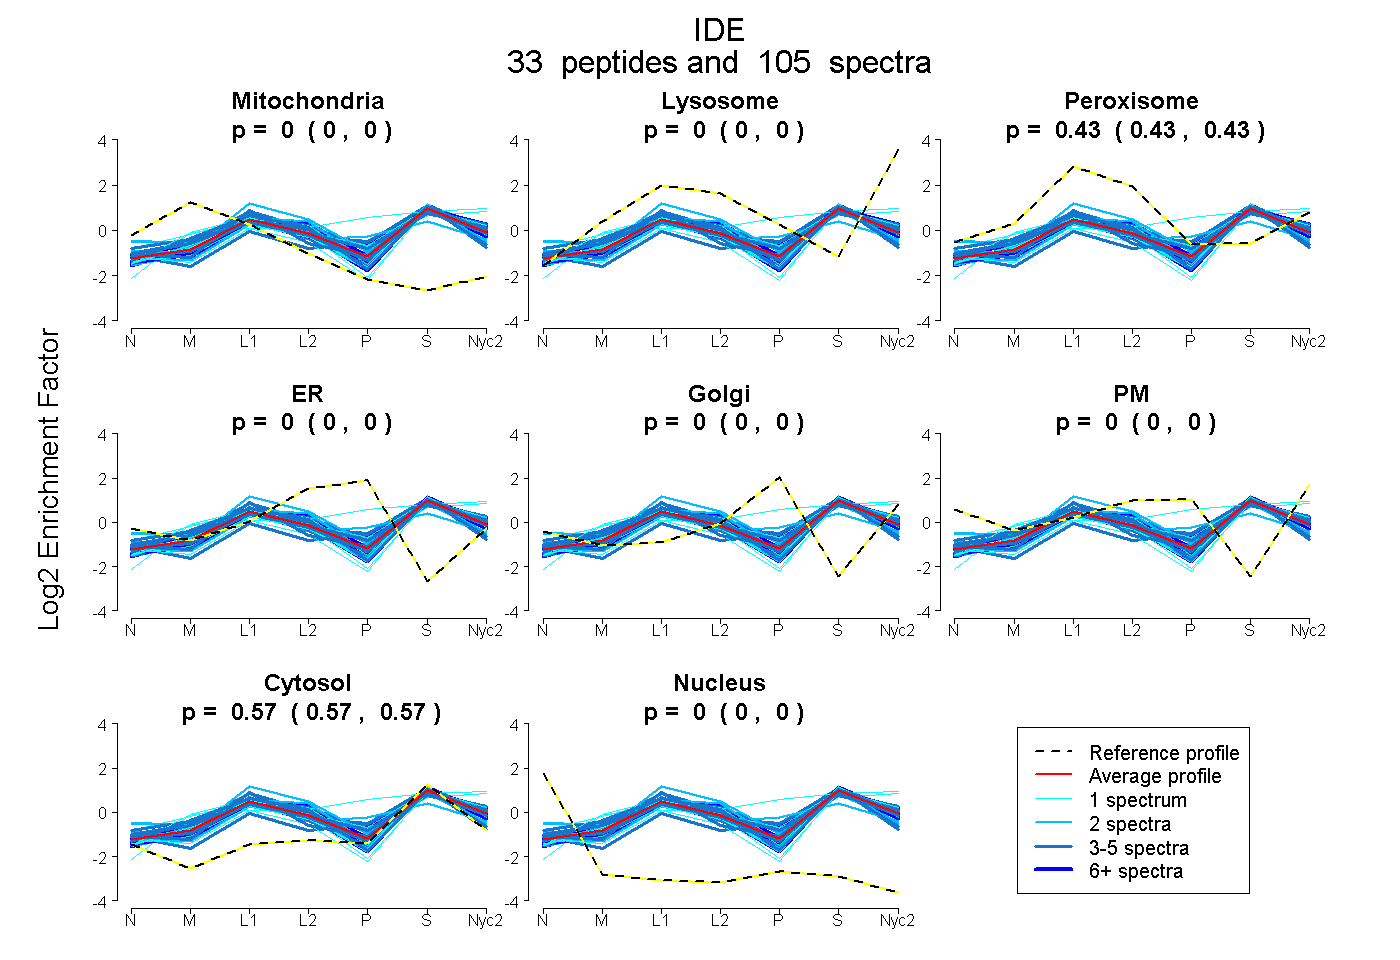
 33
33