 33
33peptides
spectra
0.000 | 0.000
0.000 | 0.003
0.426 | 0.431
0.000 | 0.000
0.000 | 0.000
0.000 | 0.000
0.569 | 0.571
0.000 | 0.000
| Plot | Mito | Lyso | Perox | ER | Golgi | PM | Cytosol | Nucleus | |||||
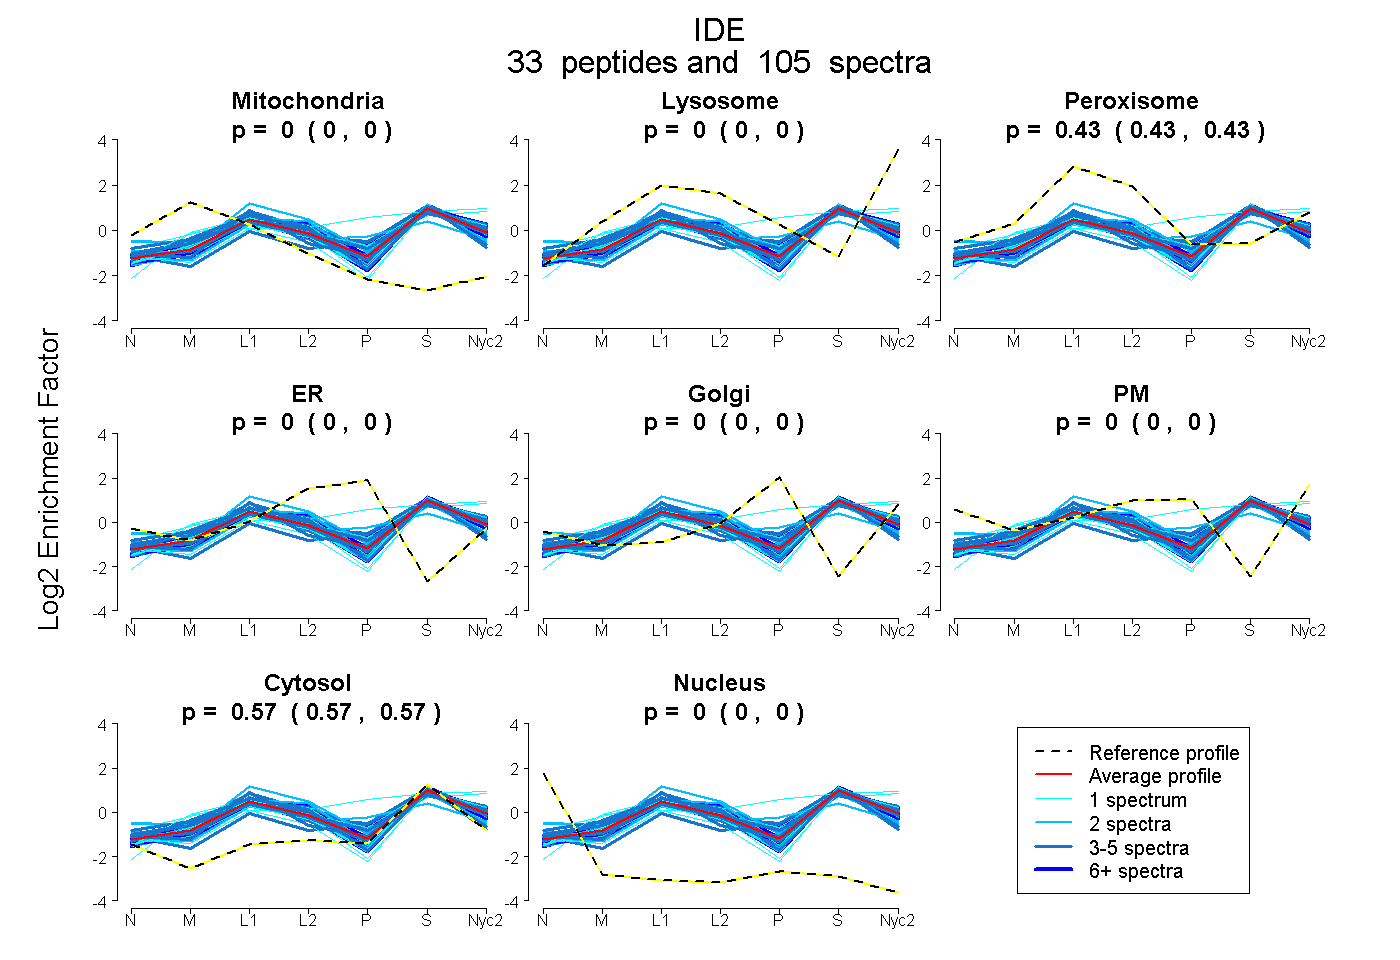
| Expt A |
33 peptides |
105 spectra |
|
0.000 0.000 | 0.000 |
0.000 0.000 | 0.003 |
0.430 0.426 | 0.431 |
0.000 0.000 | 0.000 |
0.000 0.000 | 0.000 |
0.000 0.000 | 0.000 |
0.570 0.569 | 0.571 |
0.000 0.000 | 0.000 |
| 6 spectra, AFIPQLLSR | 0.006 | 0.000 | 0.415 | 0.000 | 0.000 | 0.000 | 0.580 | 0.000 | ||
| 2 spectra, IEDHIVK | 0.009 | 0.000 | 0.329 | 0.000 | 0.000 | 0.000 | 0.662 | 0.000 | ||
| 3 spectra, NVMNDAWR | 0.061 | 0.093 | 0.338 | 0.000 | 0.000 | 0.000 | 0.508 | 0.000 | ||
| 2 spectra, EQLGYIVFSGPR | 0.007 | 0.000 | 0.382 | 0.000 | 0.000 | 0.000 | 0.611 | 0.000 | ||
| 11 spectra, HIQALAIR | 0.000 | 0.063 | 0.428 | 0.000 | 0.000 | 0.000 | 0.508 | 0.000 | ||
| 3 spectra, EMLAVDAPR | 0.000 | 0.046 | 0.470 | 0.000 | 0.000 | 0.000 | 0.485 | 0.000 | ||
| 2 spectra, NEFIPTNFEILALEK | 0.000 | 0.015 | 0.466 | 0.000 | 0.000 | 0.000 | 0.519 | 0.000 | ||
| 1 spectrum, EVQLPDR | 0.185 | 0.000 | 0.241 | 0.000 | 0.000 | 0.000 | 0.574 | 0.000 | ||
| 1 spectrum, AEGPQEWVFQECK | 0.030 | 0.000 | 0.408 | 0.000 | 0.000 | 0.000 | 0.562 | 0.000 | ||
| 4 spectra, ATGNPK | 0.000 | 0.000 | 0.241 | 0.025 | 0.003 | 0.000 | 0.731 | 0.000 | ||
| 3 spectra, VSVHVLAR | 0.021 | 0.000 | 0.379 | 0.000 | 0.000 | 0.000 | 0.600 | 0.000 | ||
| 6 spectra, EALDDVTLPR | 0.000 | 0.000 | 0.400 | 0.000 | 0.000 | 0.000 | 0.600 | 0.000 | ||
| 6 spectra, AEQPHQHAMYYLR | 0.000 | 0.105 | 0.297 | 0.000 | 0.000 | 0.000 | 0.597 | 0.000 | ||
| 2 spectra, DLNAVAFR | 0.020 | 0.000 | 0.347 | 0.000 | 0.000 | 0.000 | 0.633 | 0.000 | ||
| 3 spectra, VLLISDPTTDK | 0.000 | 0.004 | 0.401 | 0.000 | 0.000 | 0.000 | 0.594 | 0.000 | ||
| 2 spectra, MATFEIDK | 0.054 | 0.011 | 0.421 | 0.000 | 0.000 | 0.000 | 0.513 | 0.000 | ||
| 4 spectra, LFSEVENK | 0.000 | 0.084 | 0.424 | 0.000 | 0.000 | 0.000 | 0.492 | 0.000 | ||
| 2 spectra, ESLDDLTNLVVK | 0.059 | 0.000 | 0.395 | 0.000 | 0.000 | 0.000 | 0.546 | 0.000 | ||
| 4 spectra, AIEDMTEEAFQK | 0.000 | 0.117 | 0.309 | 0.000 | 0.000 | 0.000 | 0.574 | 0.000 | ||
| 1 spectrum, LLMTEVAWTK | 0.000 | 0.363 | 0.000 | 0.039 | 0.086 | 0.000 | 0.512 | 0.000 | ||
| 1 spectrum, NLYVTFPIPDLQQYYK | 0.018 | 0.000 | 0.398 | 0.000 | 0.000 | 0.000 | 0.584 | 0.000 | ||
| 3 spectra, VEAFLITMEK | 0.035 | 0.000 | 0.466 | 0.000 | 0.000 | 0.000 | 0.498 | 0.000 | ||
| 5 spectra, GWFVYQR | 0.000 | 0.000 | 0.414 | 0.000 | 0.000 | 0.000 | 0.586 | 0.000 | ||
| 2 spectra, LRPENVR | 0.000 | 0.000 | 0.552 | 0.000 | 0.000 | 0.000 | 0.448 | 0.000 | ||
| 1 spectrum, LHIEALLHGNITK | 0.000 | 0.085 | 0.379 | 0.000 | 0.000 | 0.000 | 0.536 | 0.000 | ||
| 5 spectra, FIIQSEKPPHYLESR | 0.000 | 0.069 | 0.361 | 0.000 | 0.000 | 0.000 | 0.571 | 0.000 | ||
| 1 spectrum, QPILLK | 0.000 | 0.000 | 0.351 | 0.000 | 0.000 | 0.000 | 0.649 | 0.000 | ||
| 10 spectra, GWVNTLVGGQK | 0.000 | 0.000 | 0.382 | 0.000 | 0.000 | 0.000 | 0.618 | 0.000 | ||
| 1 spectrum, NVPLPEFPEHPFQEEHLK | 0.000 | 0.016 | 0.435 | 0.000 | 0.000 | 0.000 | 0.550 | 0.000 | ||
| 1 spectrum, FGTGNK | 0.033 | 0.253 | 0.274 | 0.000 | 0.000 | 0.000 | 0.440 | 0.000 | ||
| 2 spectra, DATPYPALIK | 0.099 | 0.000 | 0.356 | 0.000 | 0.110 | 0.000 | 0.435 | 0.000 | ||
| 4 spectra, YTLETRPNQEGIDVR | 0.034 | 0.000 | 0.433 | 0.000 | 0.000 | 0.000 | 0.533 | 0.000 | ||
| 1 spectrum, TEQWYGTQYK | 0.110 | 0.009 | 0.394 | 0.000 | 0.000 | 0.000 | 0.487 | 0.000 |
| Plot | Mito | Lyso or Perox | ER | Golgi | PM | Cytosol | Nucleus | ||||||
| Expt B |
17 peptides |
35 spectra |
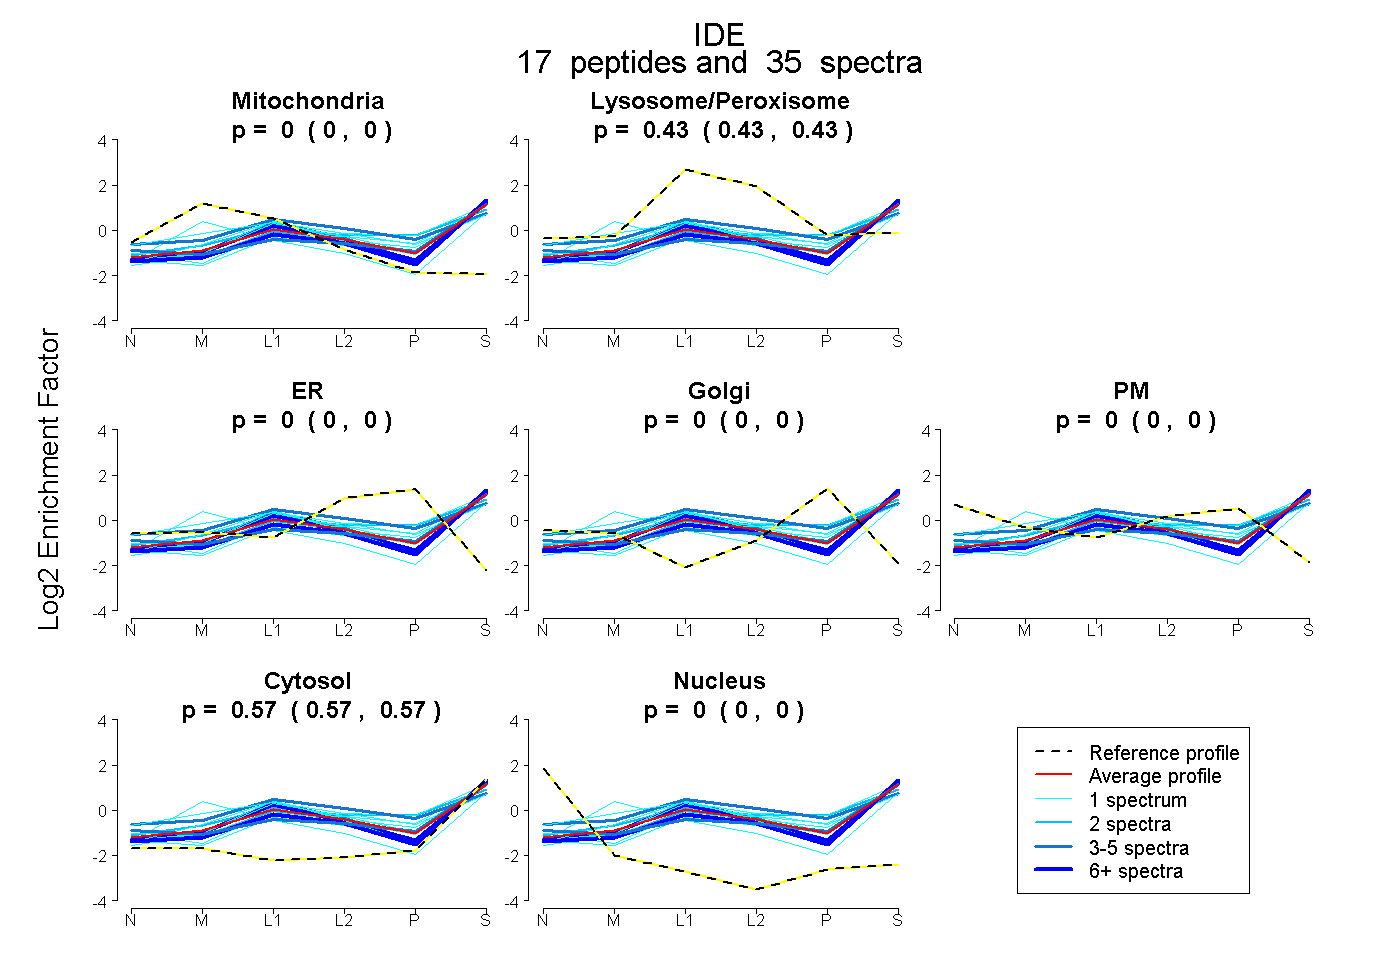 |
0.000 0.000 | 0.000 |
0.431 0.427 | 0.434 |
0.000 0.000 | 0.000 |
0.000 0.000 | 0.000 |
0.000 0.000 | 0.000 |
0.569 0.566 | 0.572 |
0.000 0.000 | 0.000 |
|||
| Plot | Lyso | Other | |||||||||||
| Expt C |
38 peptides |
262 spectra |
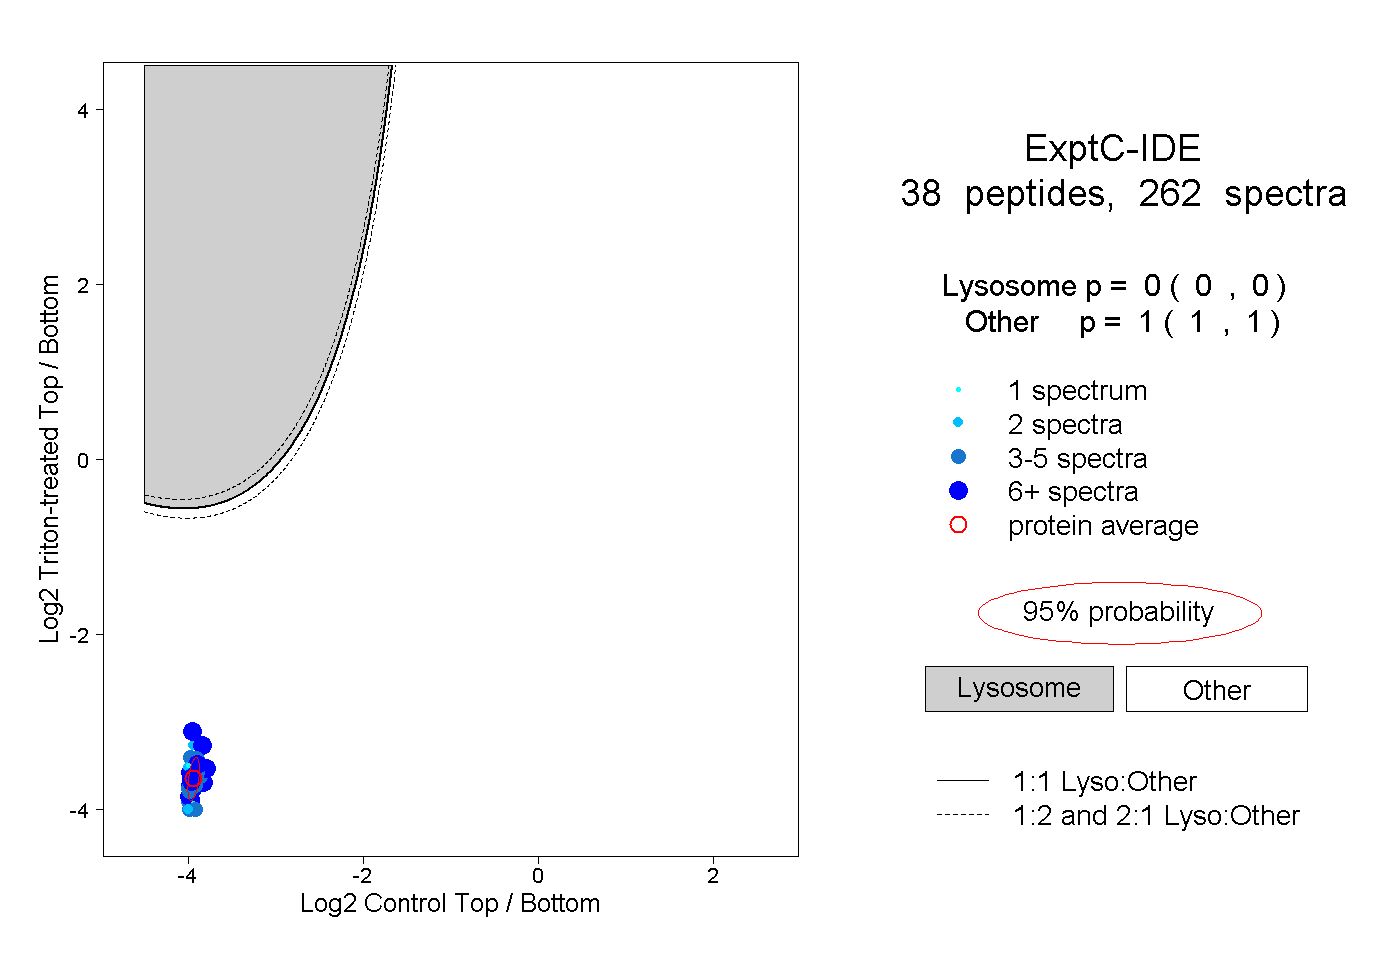 |
0.000 0.000 | 0.000 |
1.000 1.000 | 1.000 |
||||||||
| Plot | Lyso | Other | |||||||||||
| Expt D |
18 peptides |
29 spectra |
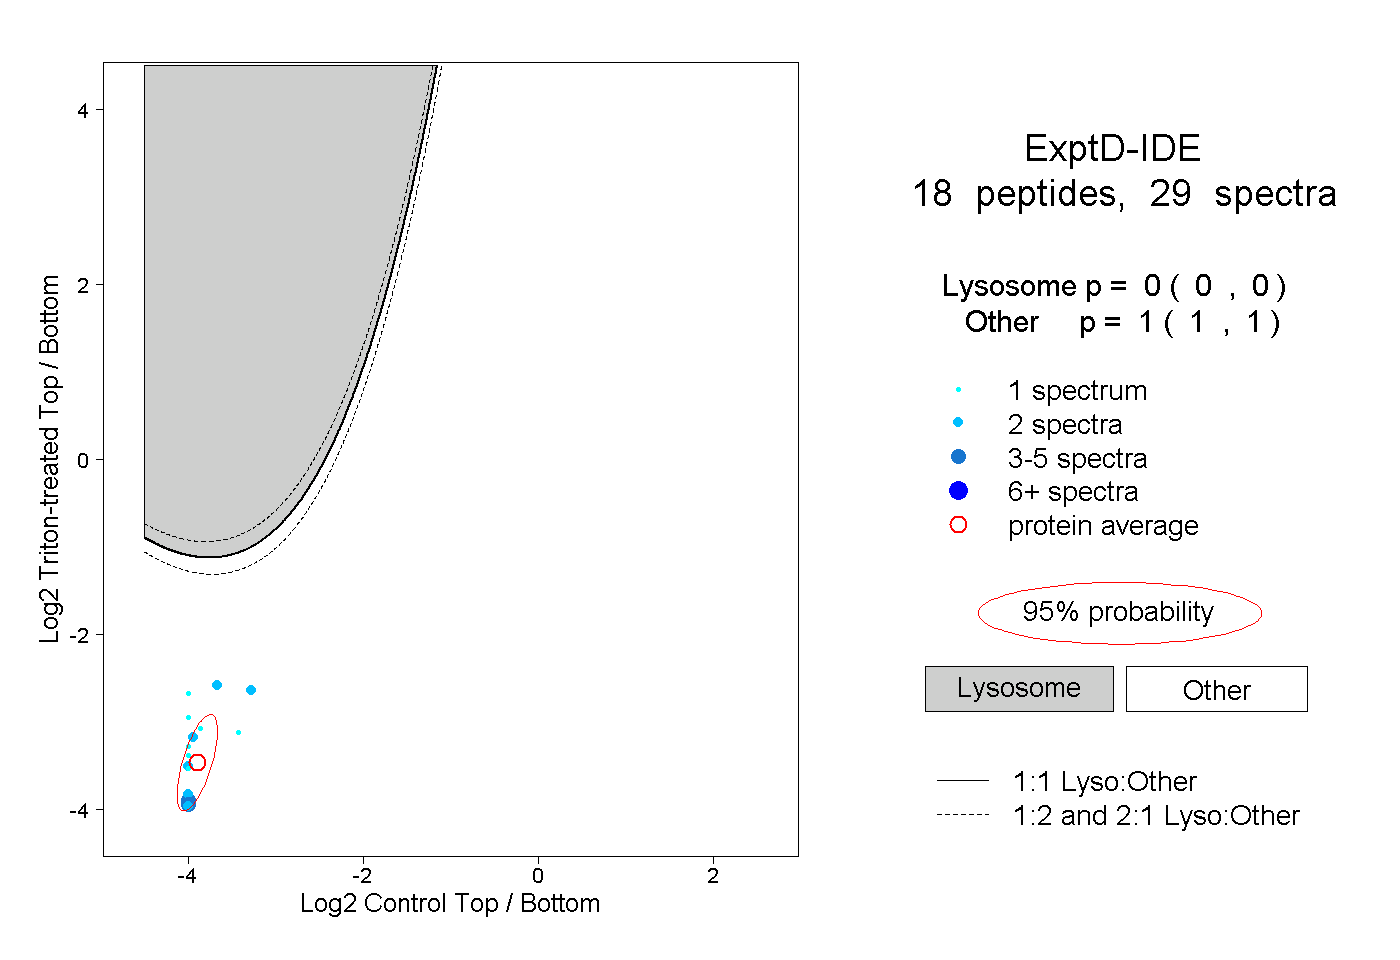 |
0.000 0.000 | 0.000 |
1.000 1.000 | 1.000 |