 4
4peptides
spectra
0.455 | 0.582
0.000 | 0.093
0.031 | 0.172
0.000 | 0.000
0.000 | 0.076
0.094 | 0.268
0.077 | 0.174
0.000 | 0.000
| Plot | Mito | Lyso | Perox | ER | Golgi | PM | Cytosol | Nucleus | |||||
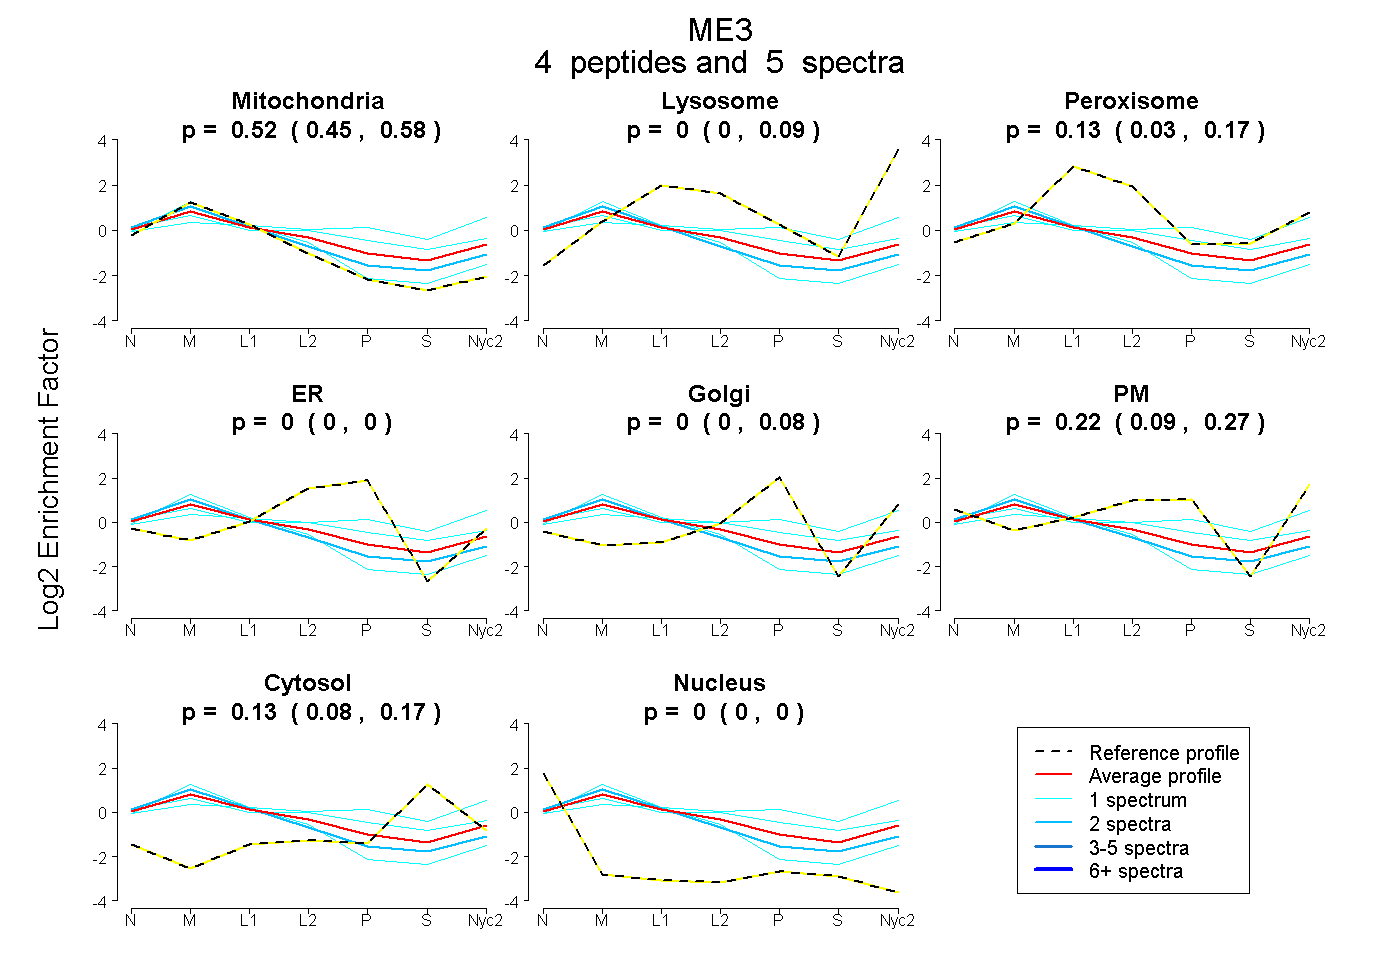
| Expt A |
4 peptides |
5 spectra |
|
0.517 0.455 | 0.582 |
0.002 0.000 | 0.093 |
0.130 0.031 | 0.172 |
0.000 0.000 | 0.000 |
0.000 0.000 | 0.076 |
0.219 0.094 | 0.268 |
0.132 0.077 | 0.174 |
0.000 0.000 | 0.000 |
| 1 spectrum, EMFAQEHPEVNSLEEVVR | 0.352 | 0.000 | 0.159 | 0.000 | 0.000 | 0.296 | 0.193 | 0.000 | ||
| 1 spectrum, SGPPRPVPLK | 0.879 | 0.020 | 0.062 | 0.000 | 0.000 | 0.035 | 0.000 | 0.004 | ||
| 1 spectrum, HNLASYYPEPK | 0.145 | 0.094 | 0.173 | 0.000 | 0.051 | 0.299 | 0.238 | 0.000 | ||
| 2 spectra, SVTLEDGR | 0.706 | 0.000 | 0.066 | 0.000 | 0.000 | 0.146 | 0.083 | 0.000 |
| Plot | Mito | Lyso or Perox | ER | Golgi | PM | Cytosol | Nucleus | ||||||
| Expt B |
1 peptide |
1 spectrum |
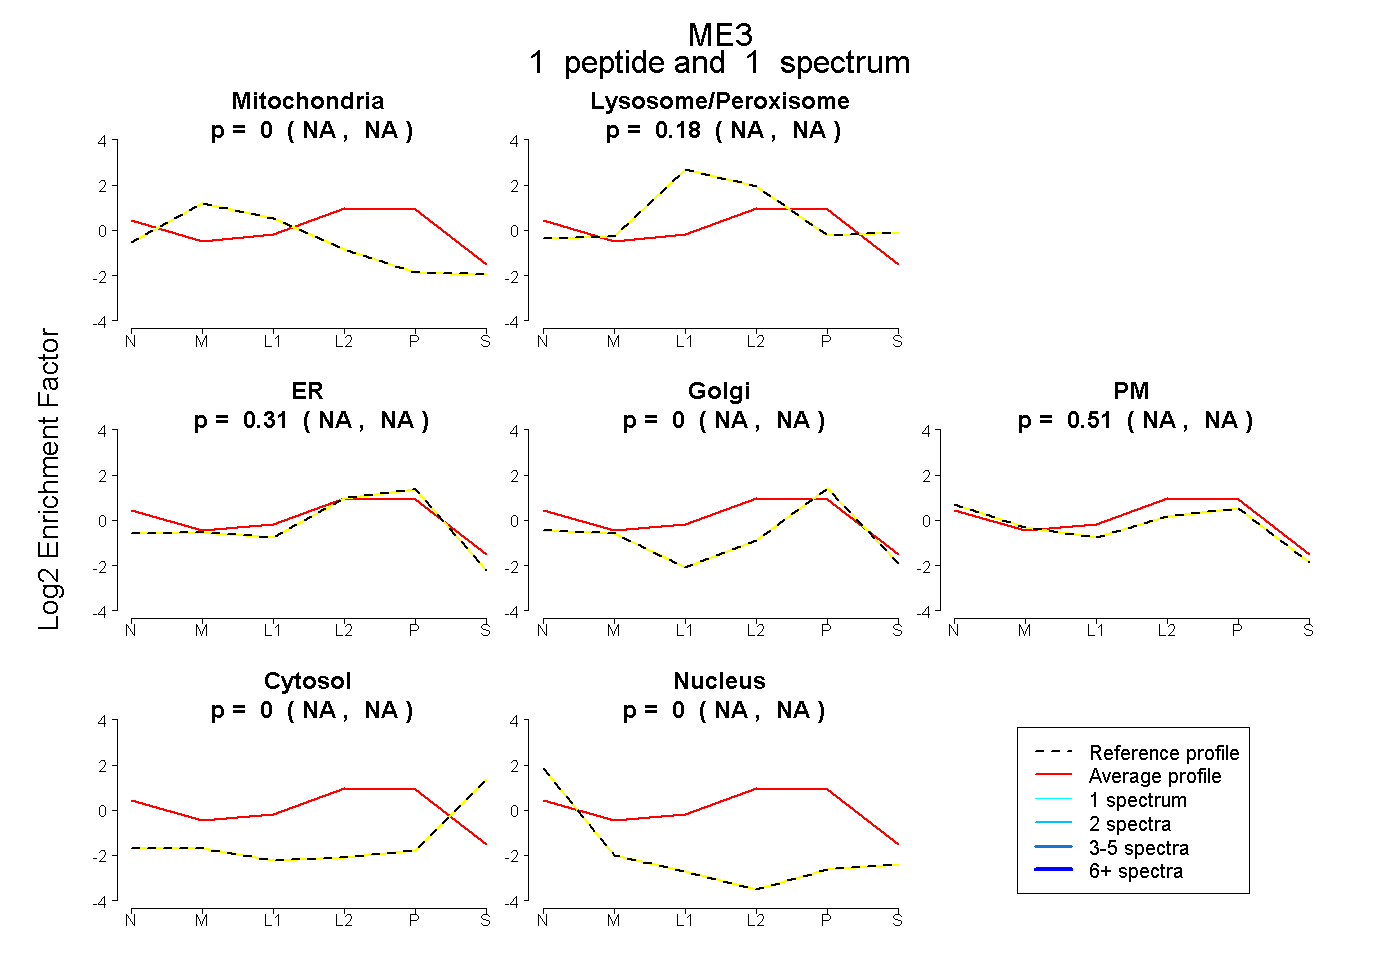 |
0.000 NA | NA |
0.179 NA | NA |
0.306 NA | NA |
0.000 NA | NA |
0.514 NA | NA |
0.000 NA | NA |
0.000 NA | NA |
|||
| Plot | Lyso | Other | |||||||||||
| Expt C |
9 peptides |
40 spectra |
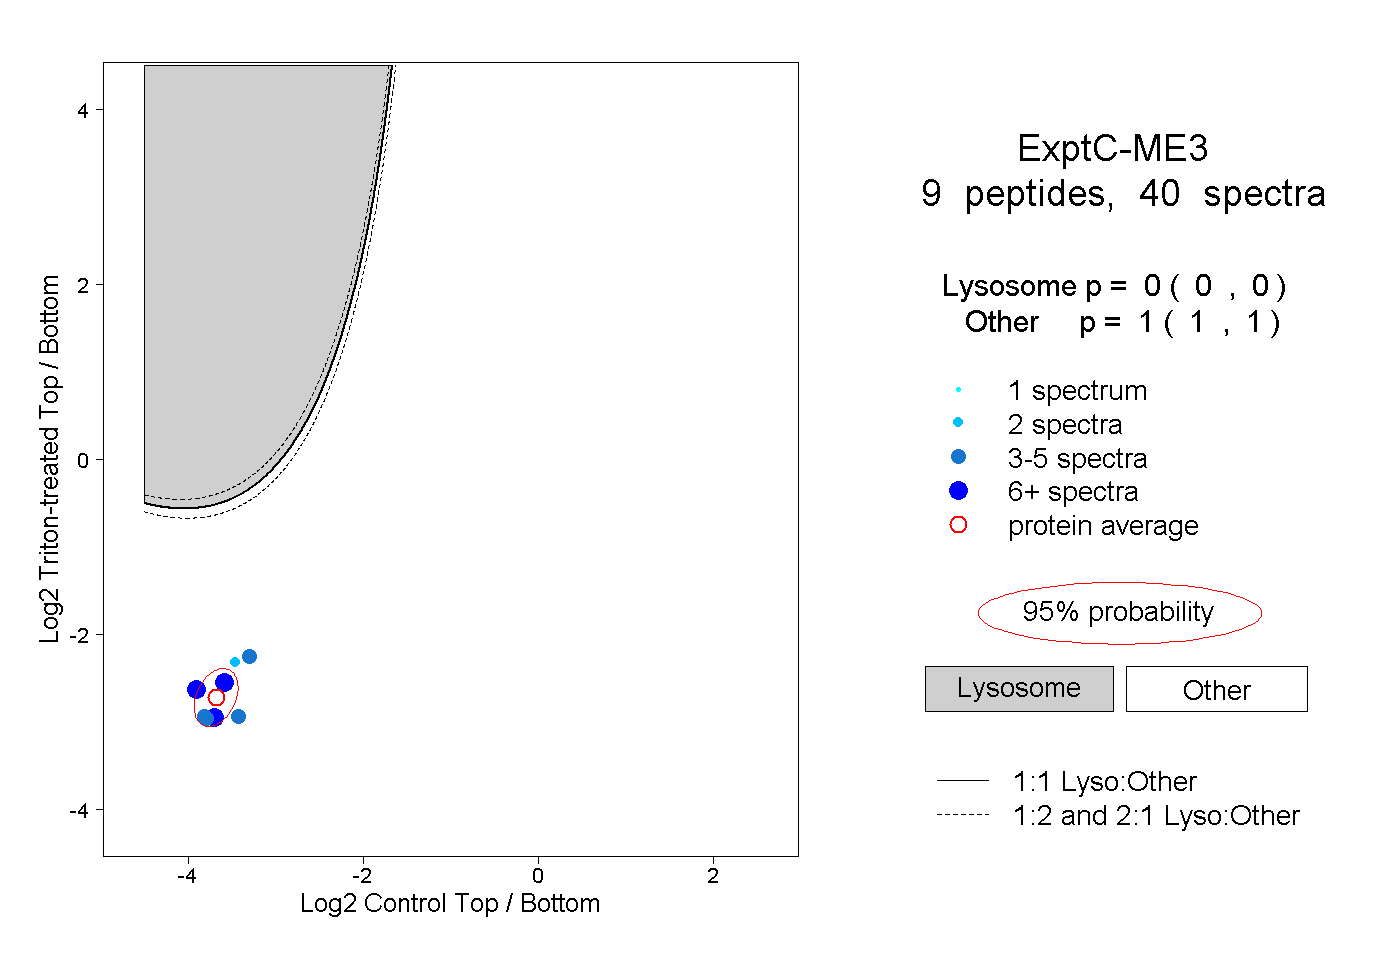 |
0.000 0.000 | 0.000 |
1.000 1.000 | 1.000 |
||||||||
| Plot | Lyso | Other | |||||||||||
| Expt D |
2 peptides |
2 spectra |
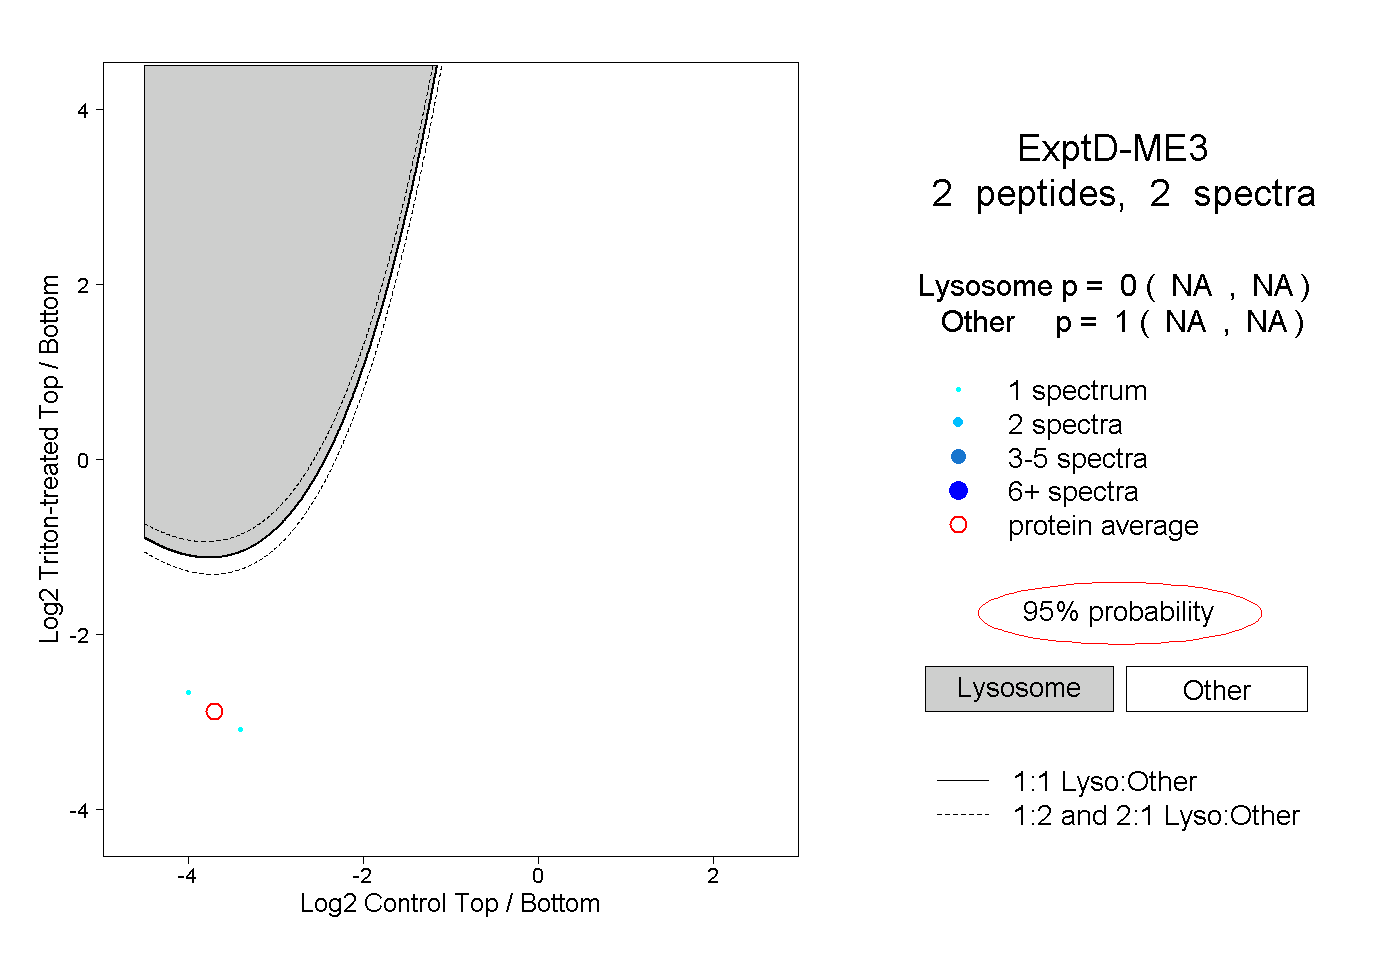 |
0.000 NA | NA |
1.000 NA | NA |