 2
2peptides
spectra
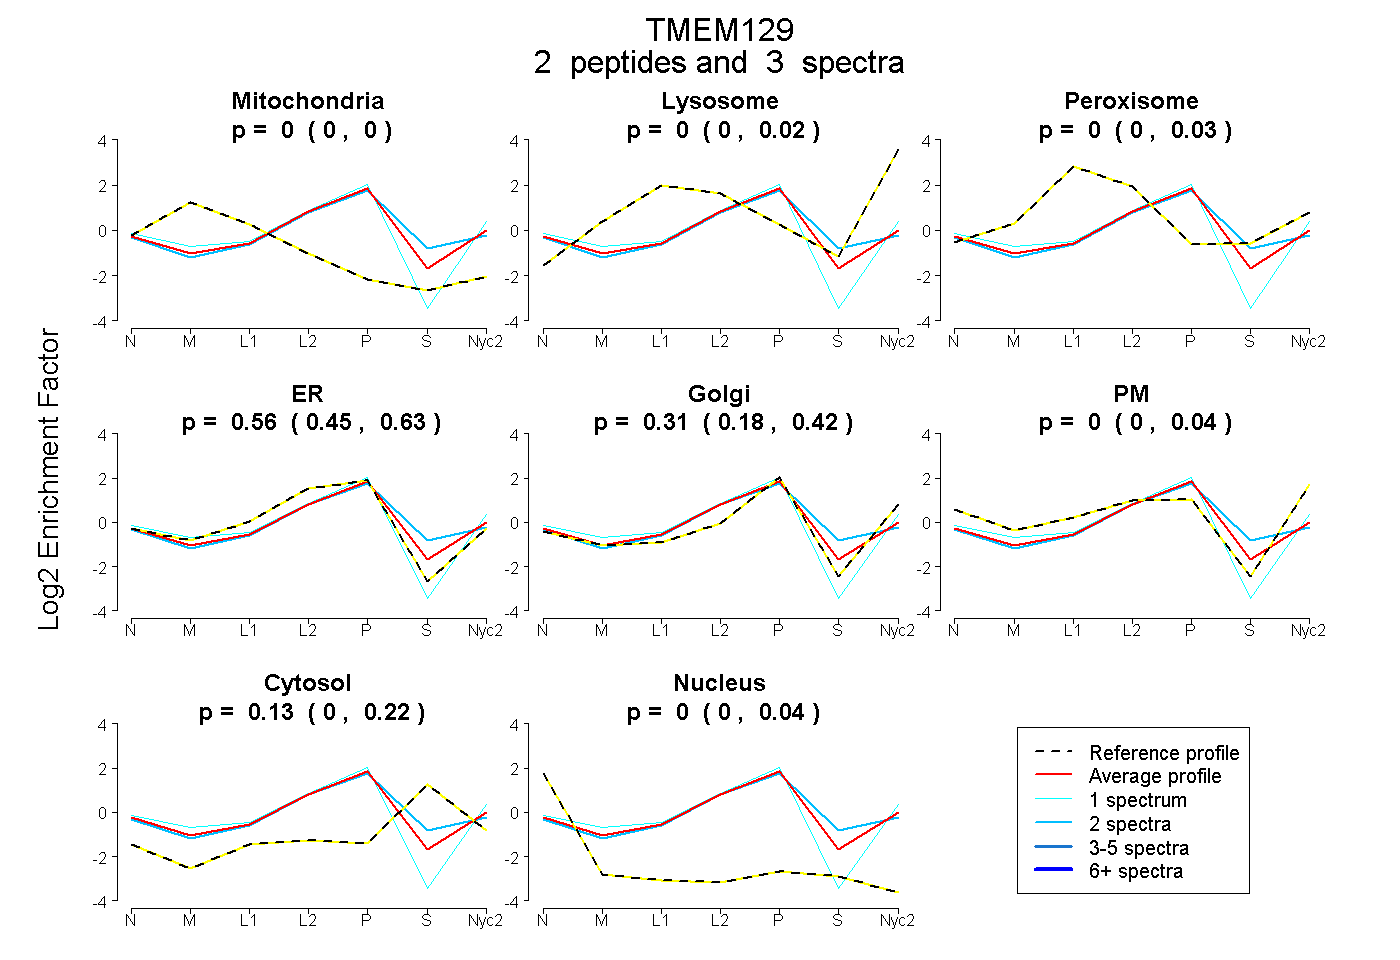
0.000 | 0.000
0.000 | 0.025
0.000 | 0.032
0.449 | 0.629
0.178 | 0.415
0.000 | 0.039
0.000 | 0.217
0.000 | 0.038
| Plot | Mito | Lyso | Perox | ER | Golgi | PM | Cytosol | Nucleus | |||||
| Expt A |
2 peptides |
3 spectra |
|
0.000 0.000 | 0.000 |
0.000 0.000 | 0.025 |
0.000 0.000 | 0.032 |
0.563 0.449 | 0.629 |
0.309 0.178 | 0.415 |
0.000 0.000 | 0.039 |
0.128 0.000 | 0.217 |
0.000 0.000 | 0.038 |