 3
3peptides
spectra
0.000 | 0.000
0.182 | 0.381
0.000 | 0.000
0.000 | 0.000
0.000 | 0.088
0.057 | 0.250
0.462 | 0.581
0.000 | 0.000
2peptides
spectra
0.000 | 0.000
1.000 | 1.000
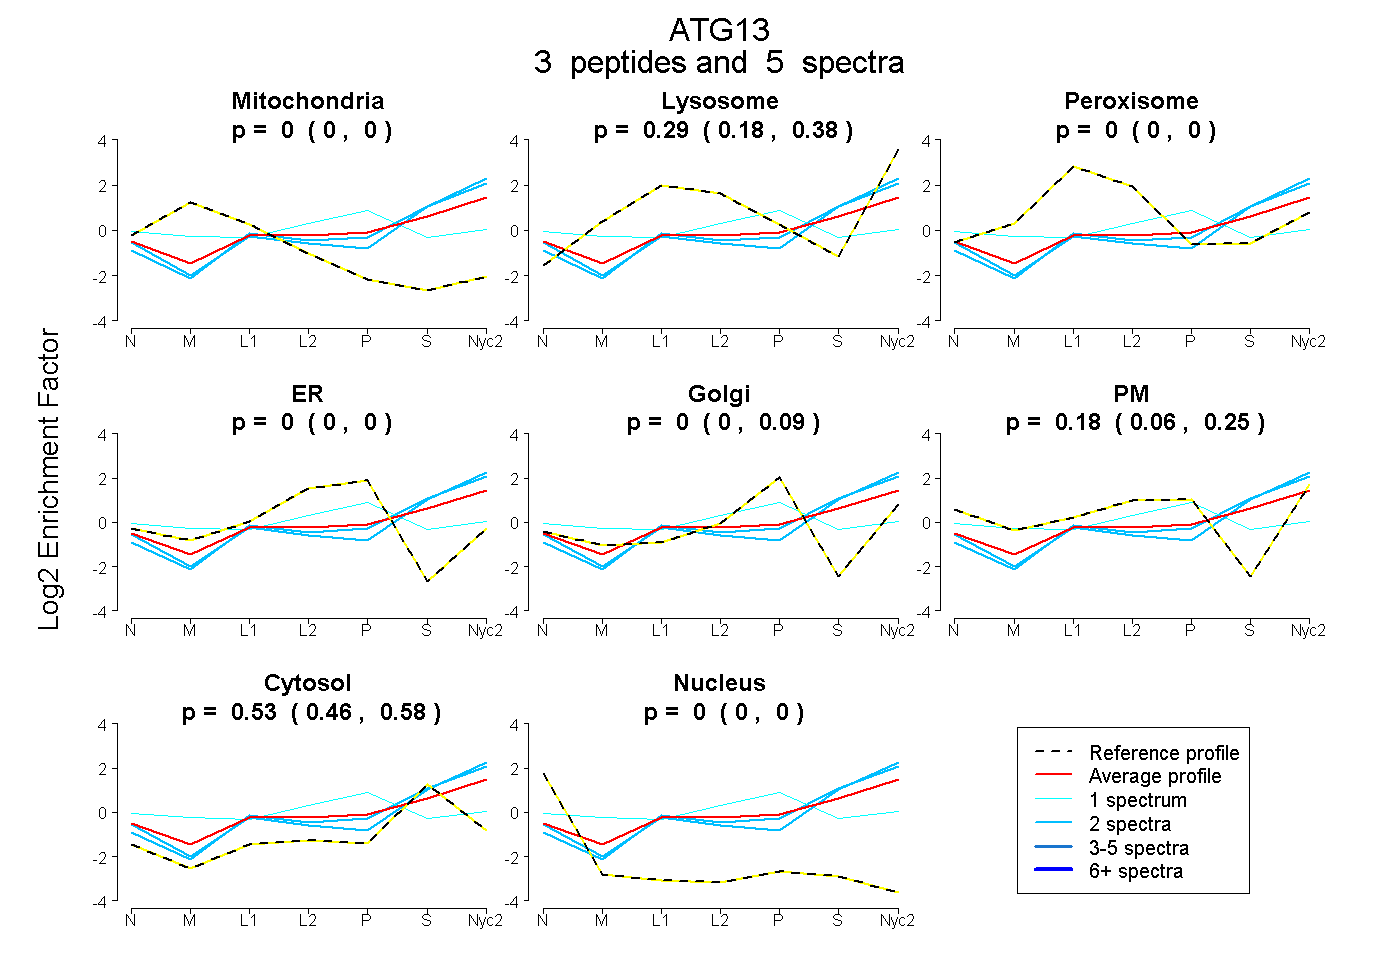
| Plot | Mito | Lyso | Perox | ER | Golgi | PM | Cytosol | Nucleus | |||||
| Expt A |
3 peptides |
5 spectra |
|
0.000 0.000 | 0.000 |
0.292 0.182 | 0.381 |
0.000 0.000 | 0.000 |
0.000 0.000 | 0.000 |
0.000 0.000 | 0.088 |
0.176 0.057 | 0.250 |
0.532 0.462 | 0.581 |
0.000 0.000 | 0.000 |
||
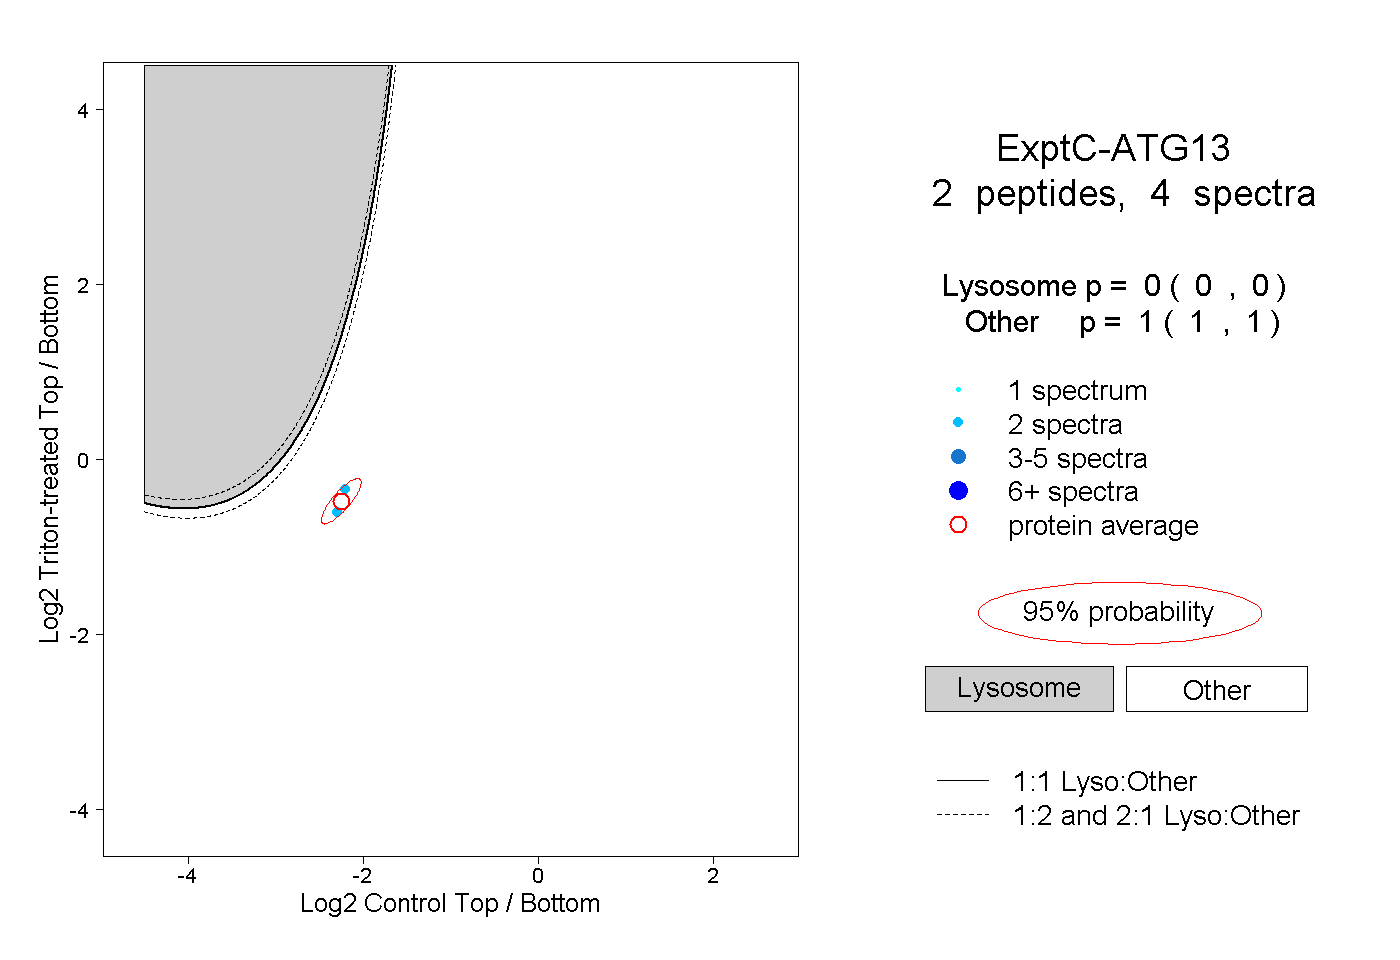
| Plot | Lyso | Other | |||||||||||
| Expt C |
2 peptides |
4 spectra |
|
0.000 0.000 | 0.000 |
1.000 1.000 | 1.000 |