9
9peptides
spectra
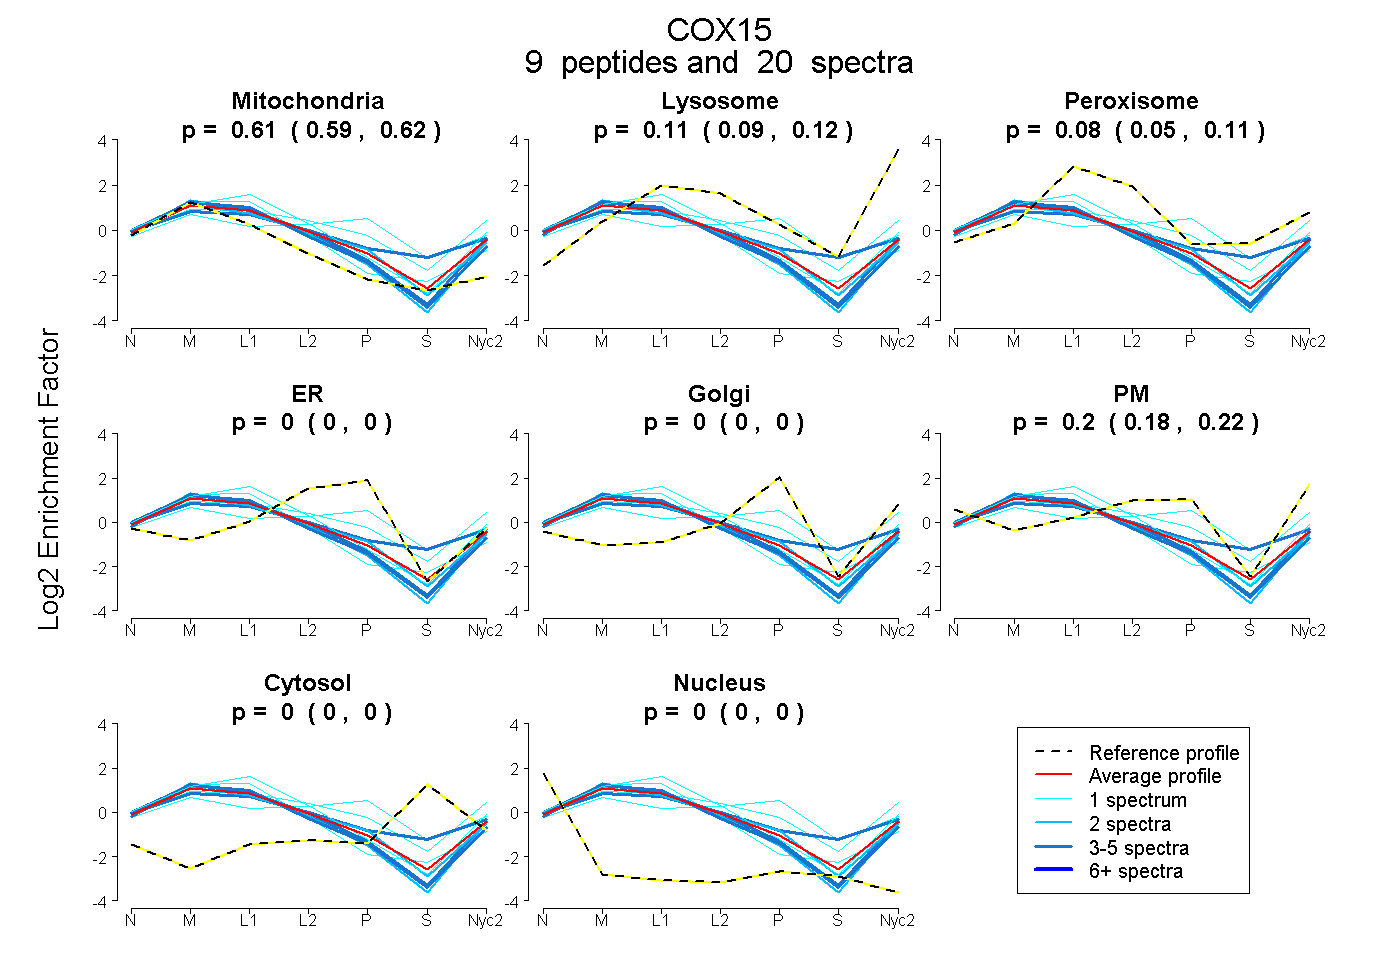
0.592 | 0.618
0.090 | 0.124
0.052 | 0.107
0.000 | 0.000
0.000 | 0.000
0.182 | 0.219
0.000 | 0.000
0.000 | 0.000
4peptides
spectra
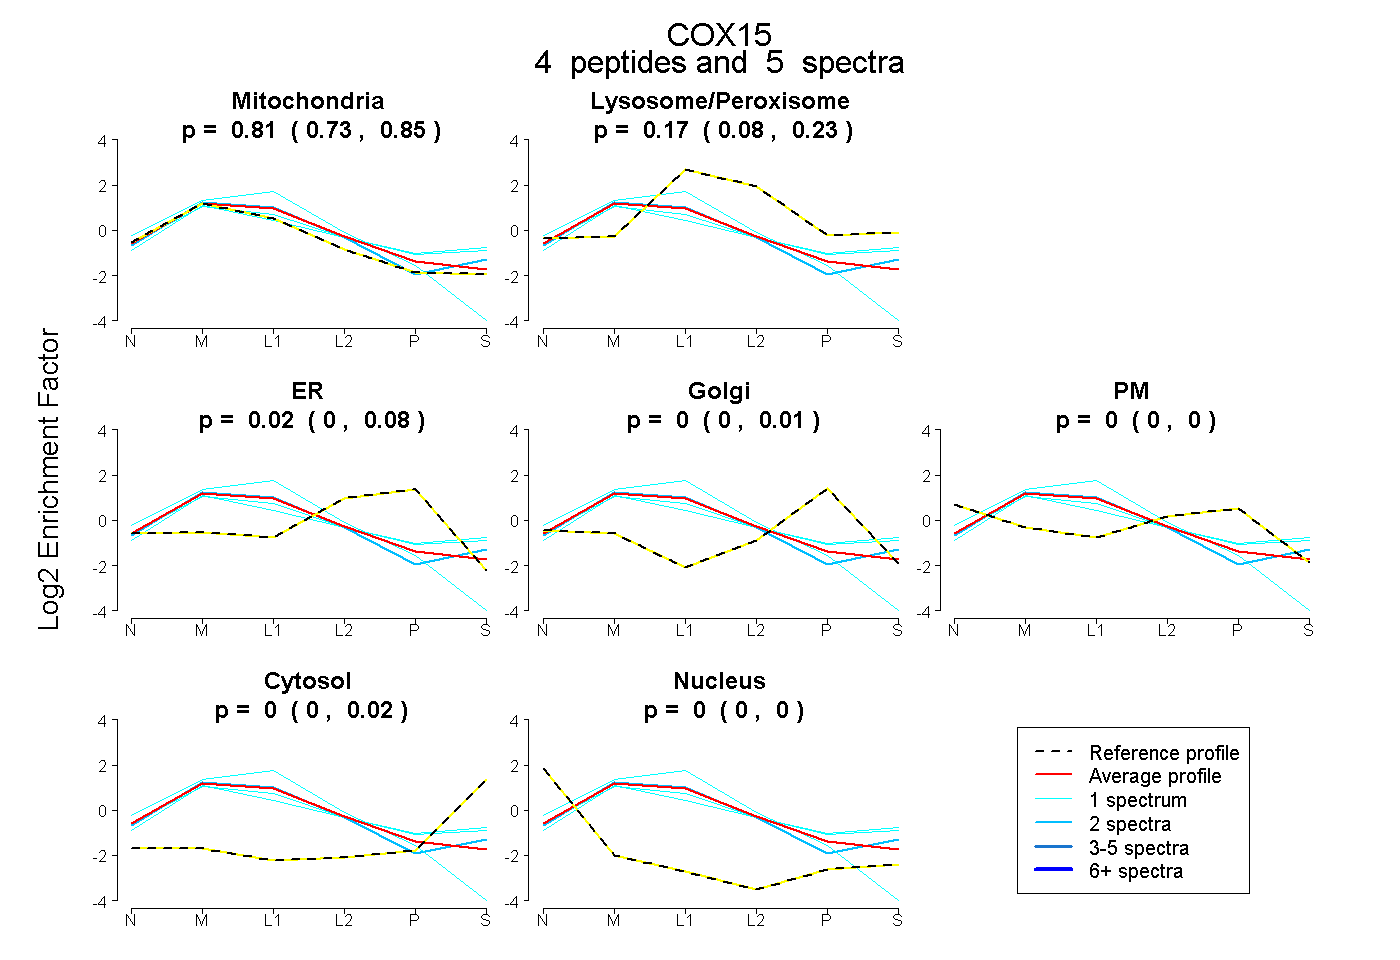
0.726 | 0.851
0.080 | 0.233
0.000 | 0.082
0.000 | 0.006
0.000 | 0.000
0.000 | 0.022
0.000 | 0.000