 9
9peptides
spectra
0.592 | 0.618
0.090 | 0.124
0.052 | 0.107
0.000 | 0.000
0.000 | 0.000
0.182 | 0.219
0.000 | 0.000
0.000 | 0.000
| Plot | Mito | Lyso | Perox | ER | Golgi | PM | Cytosol | Nucleus | |||||
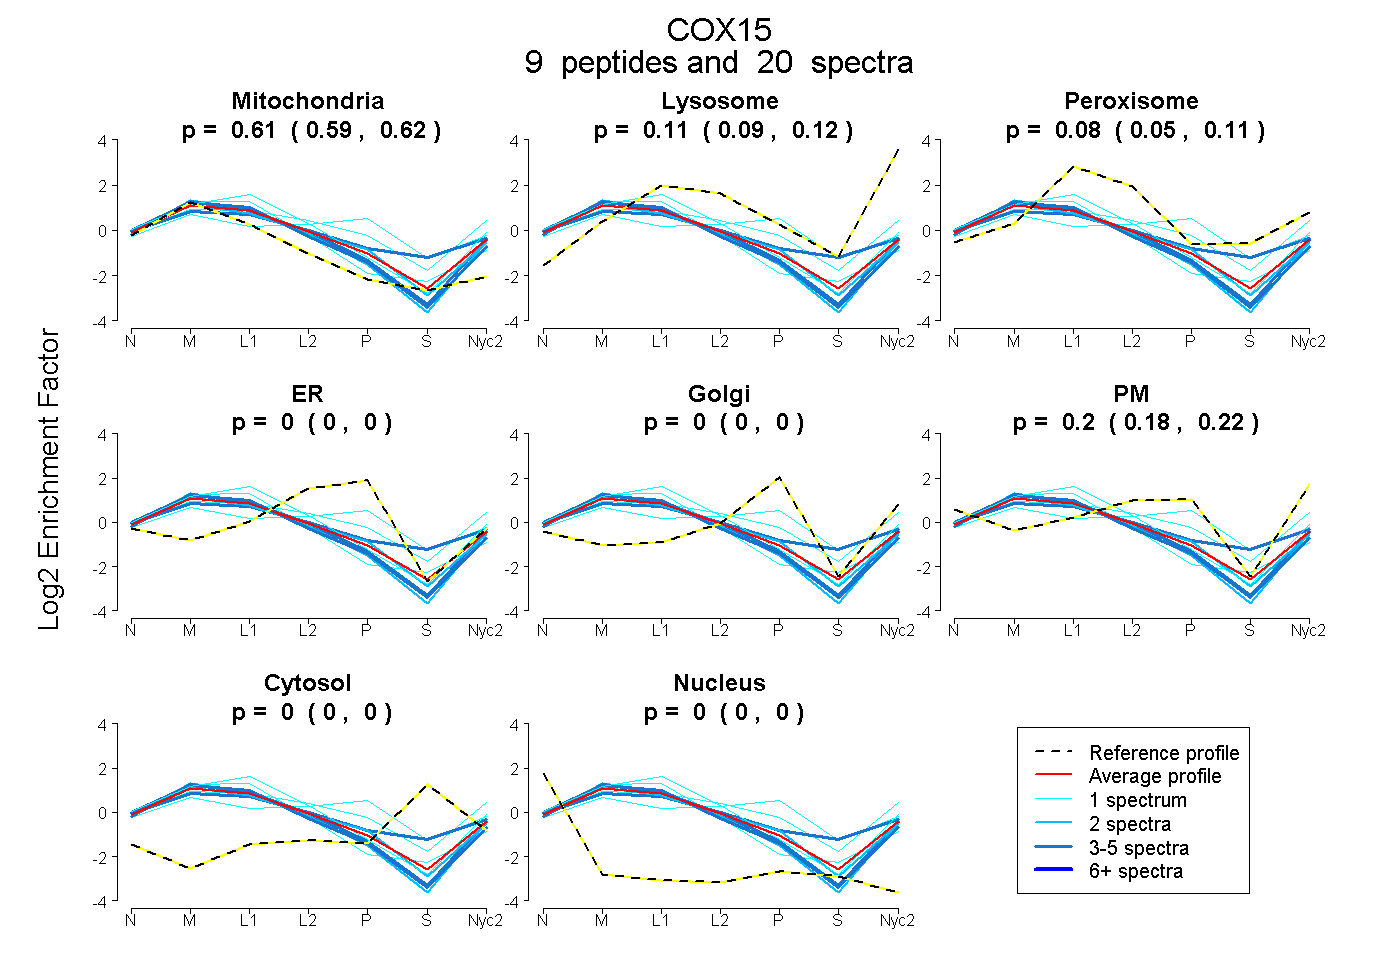
| Expt A |
9 peptides |
20 spectra |
|
0.607 0.592 | 0.618 |
0.108 0.090 | 0.124 |
0.082 0.052 | 0.107 |
0.000 0.000 | 0.000 |
0.000 0.000 | 0.000 |
0.203 0.182 | 0.219 |
0.000 0.000 | 0.000 |
0.000 0.000 | 0.000 |
| 1 spectrum, EMKPPTSQEEWEAEFQK | 0.704 | 0.053 | 0.243 | 0.000 | 0.000 | 0.000 | 0.000 | 0.000 | ||
| 1 spectrum, ILNHDMTLAEFK | 0.365 | 0.145 | 0.165 | 0.000 | 0.000 | 0.325 | 0.000 | 0.000 | ||
| 2 spectra, QLLWLR | 0.617 | 0.079 | 0.020 | 0.016 | 0.000 | 0.268 | 0.000 | 0.000 | ||
| 1 spectrum, FIWYMEYSHR | 0.268 | 0.000 | 0.284 | 0.002 | 0.427 | 0.000 | 0.019 | 0.000 | ||
| 3 spectra, SGLEEKPESYDIPR | 0.726 | 0.095 | 0.000 | 0.000 | 0.000 | 0.179 | 0.000 | 0.000 | ||
| 5 spectra, NVFENPTMVQFDHR | 0.432 | 0.016 | 0.278 | 0.000 | 0.000 | 0.183 | 0.091 | 0.000 | ||
| 2 spectra, IPLPR | 0.711 | 0.120 | 0.000 | 0.000 | 0.000 | 0.170 | 0.000 | 0.000 | ||
| 4 spectra, LTESGLSMVDWHLIK | 0.680 | 0.155 | 0.000 | 0.000 | 0.000 | 0.165 | 0.000 | 0.000 | ||
| 1 spectrum, YQQFPEFK | 0.533 | 0.119 | 0.218 | 0.000 | 0.000 | 0.130 | 0.000 | 0.000 |
| Plot | Mito | Lyso or Perox | ER | Golgi | PM | Cytosol | Nucleus | ||||||
| Expt B |
4 peptides |
5 spectra |
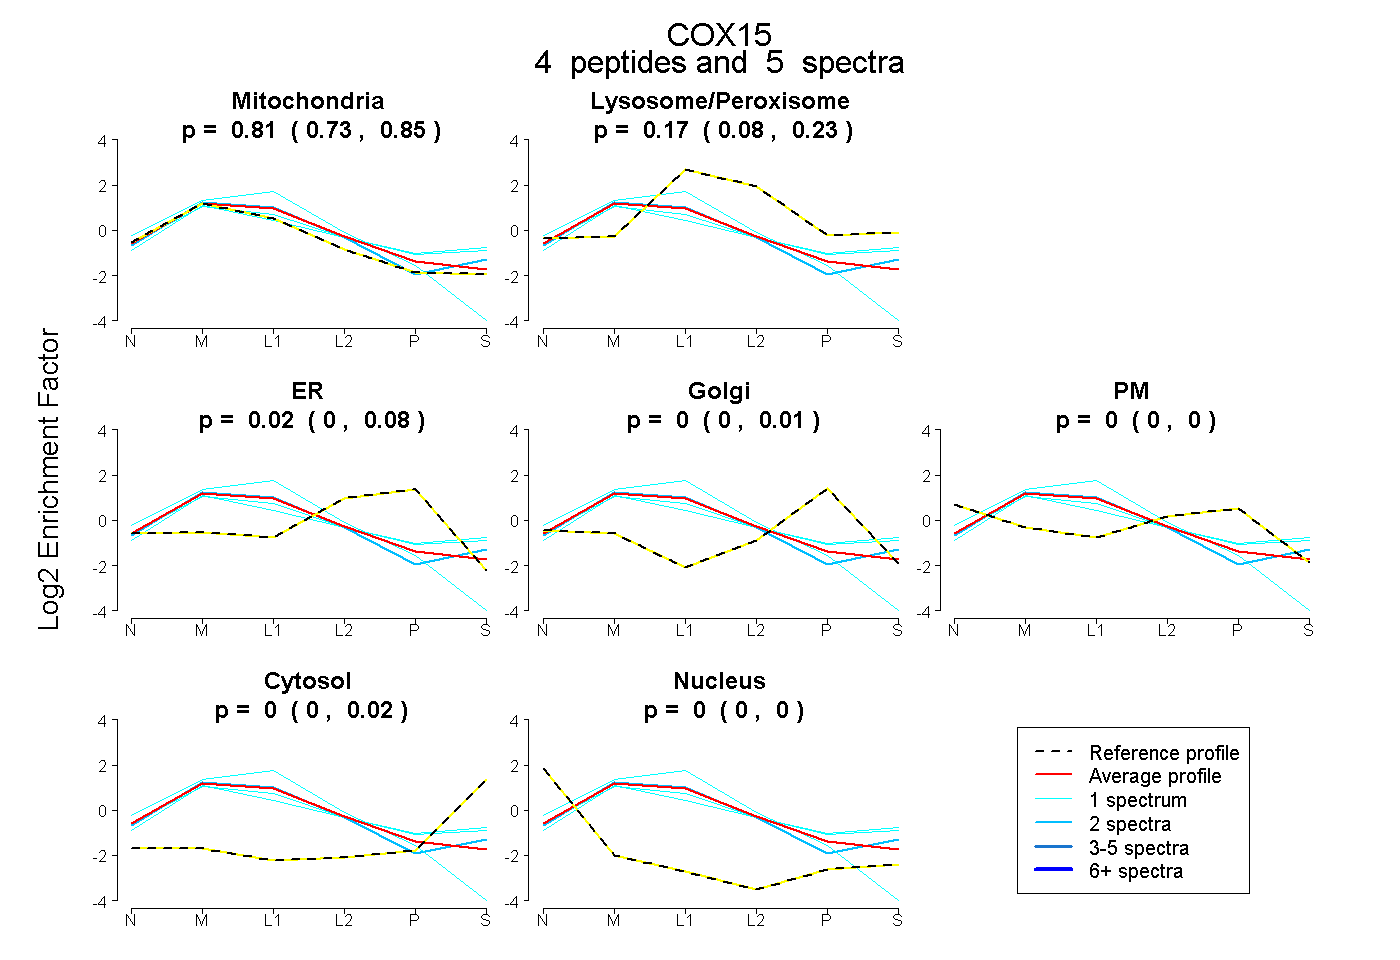 |
0.814 0.726 | 0.851 |
0.169 0.080 | 0.233 |
0.018 0.000 | 0.082 |
0.000 0.000 | 0.006 |
0.000 0.000 | 0.000 |
0.000 0.000 | 0.022 |
0.000 0.000 | 0.000 |
|||
| Plot | Lyso | Other | |||||||||||
| Expt C |
9 peptides |
63 spectra |
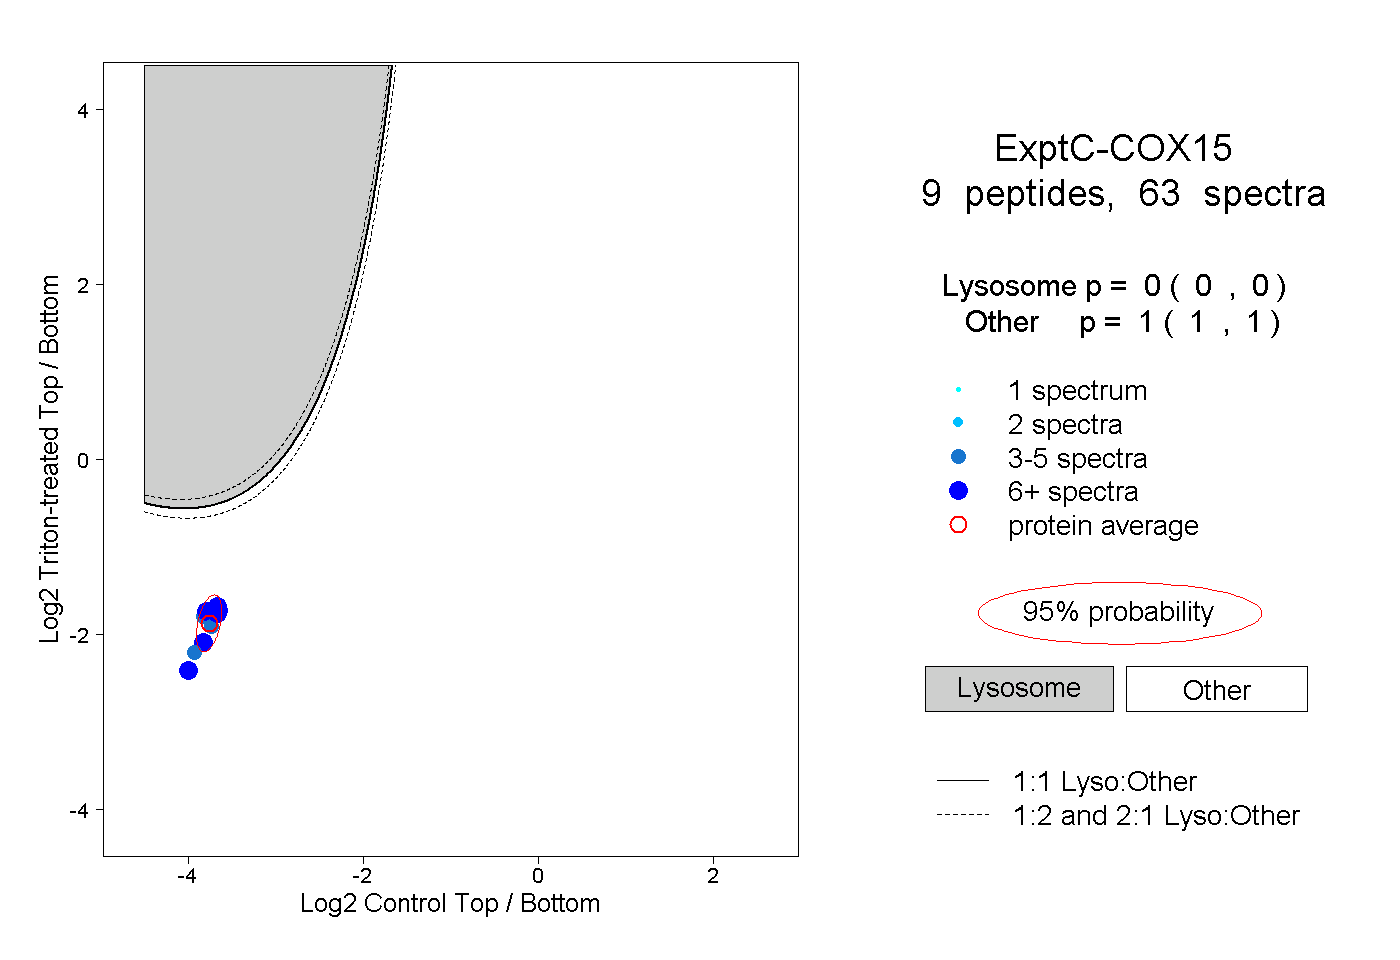 |
0.000 0.000 | 0.000 |
1.000 1.000 | 1.000 |
||||||||
| Plot | Lyso | Other | |||||||||||
| Expt D |
3 peptides |
10 spectra |
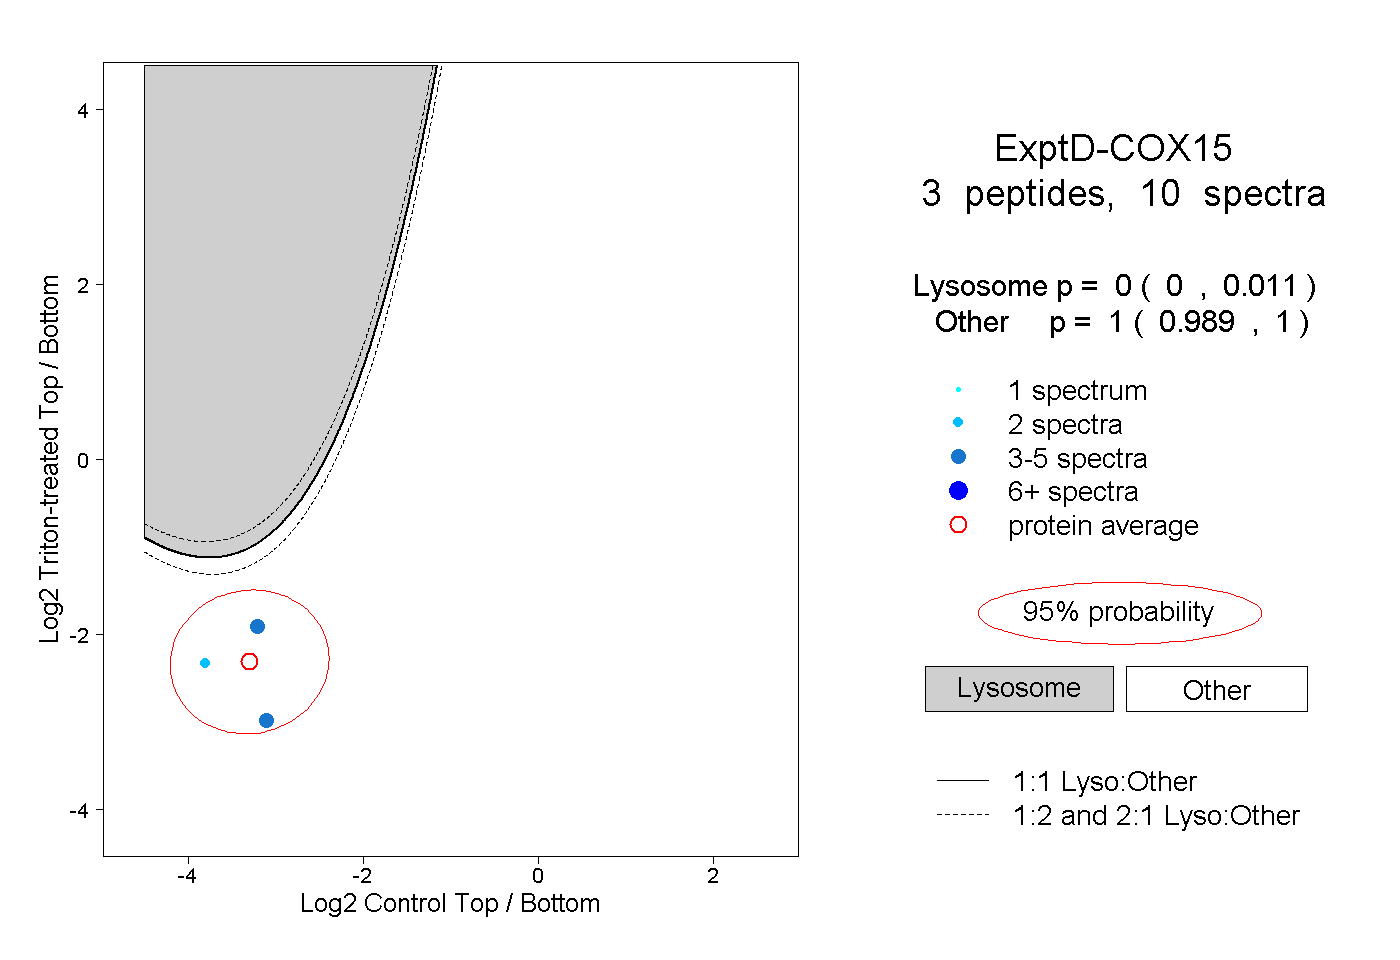 |
0.000 0.000 | 0.011 |
1.000 0.989 | 1.000 |