 10
10peptides
spectra
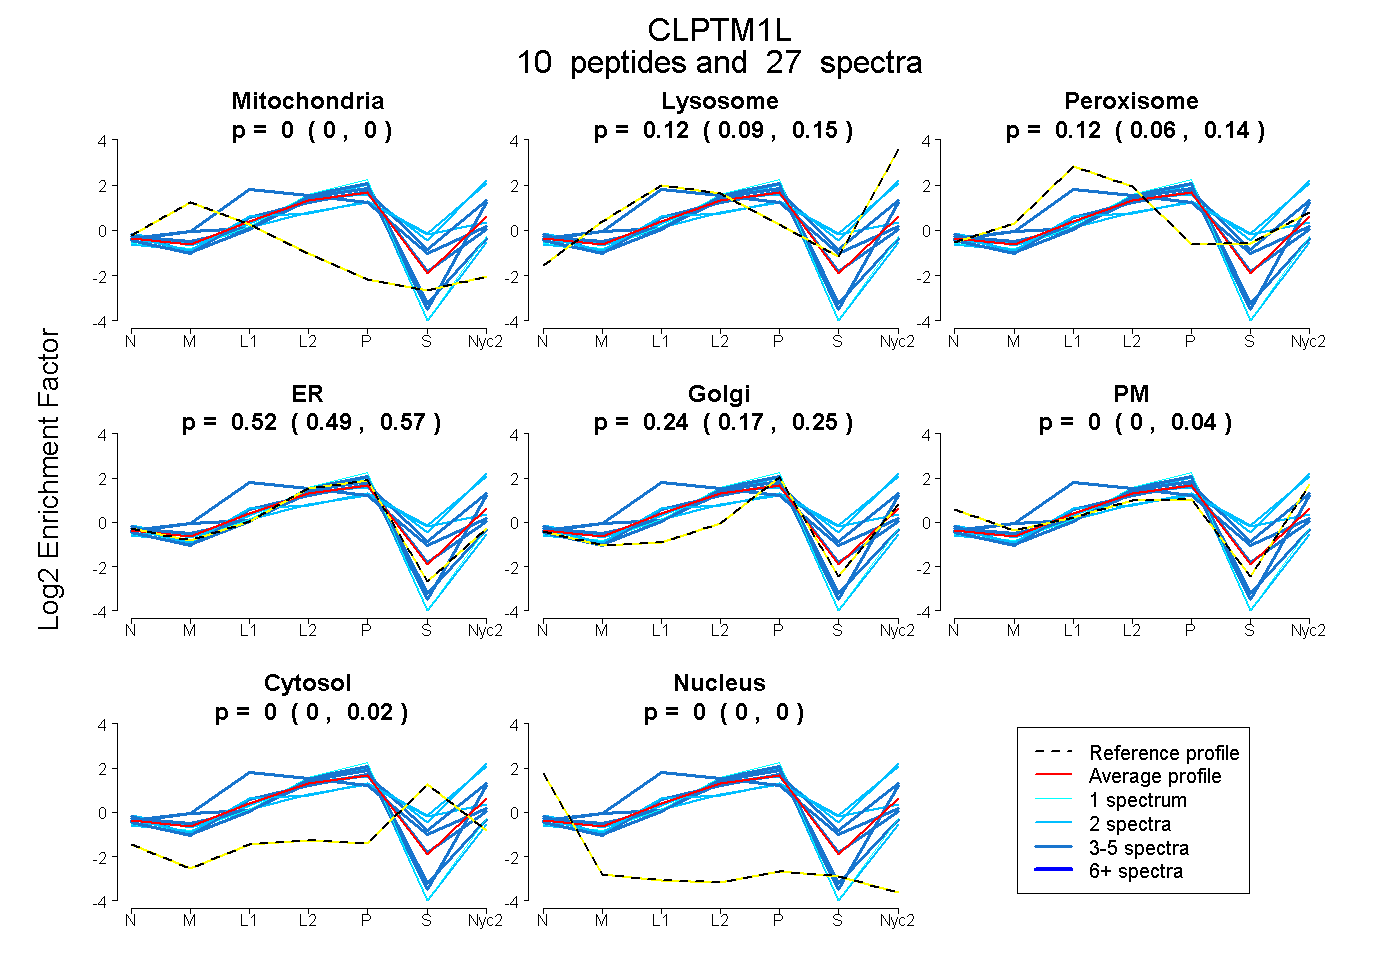
0.000 | 0.000
0.091 | 0.150
0.060 | 0.140
0.487 | 0.570
0.174 | 0.254
0.000 | 0.043
0.000 | 0.018
0.000 | 0.000
1peptide
spectra
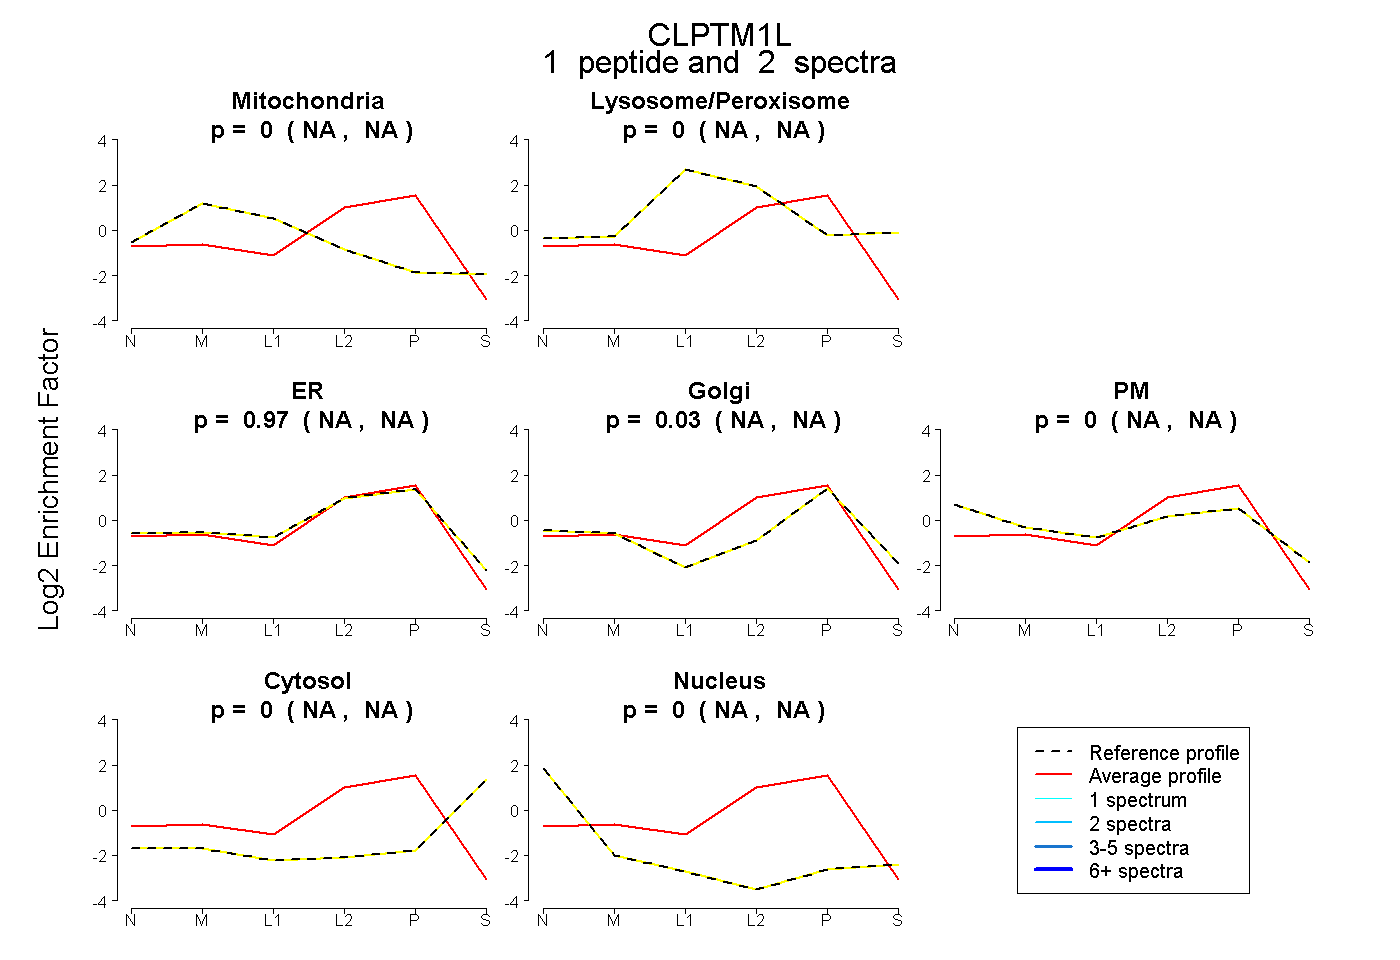
NA | NA
NA | NA
NA | NA
NA | NA
NA | NA
NA | NA
NA | NA
7peptides
spectra
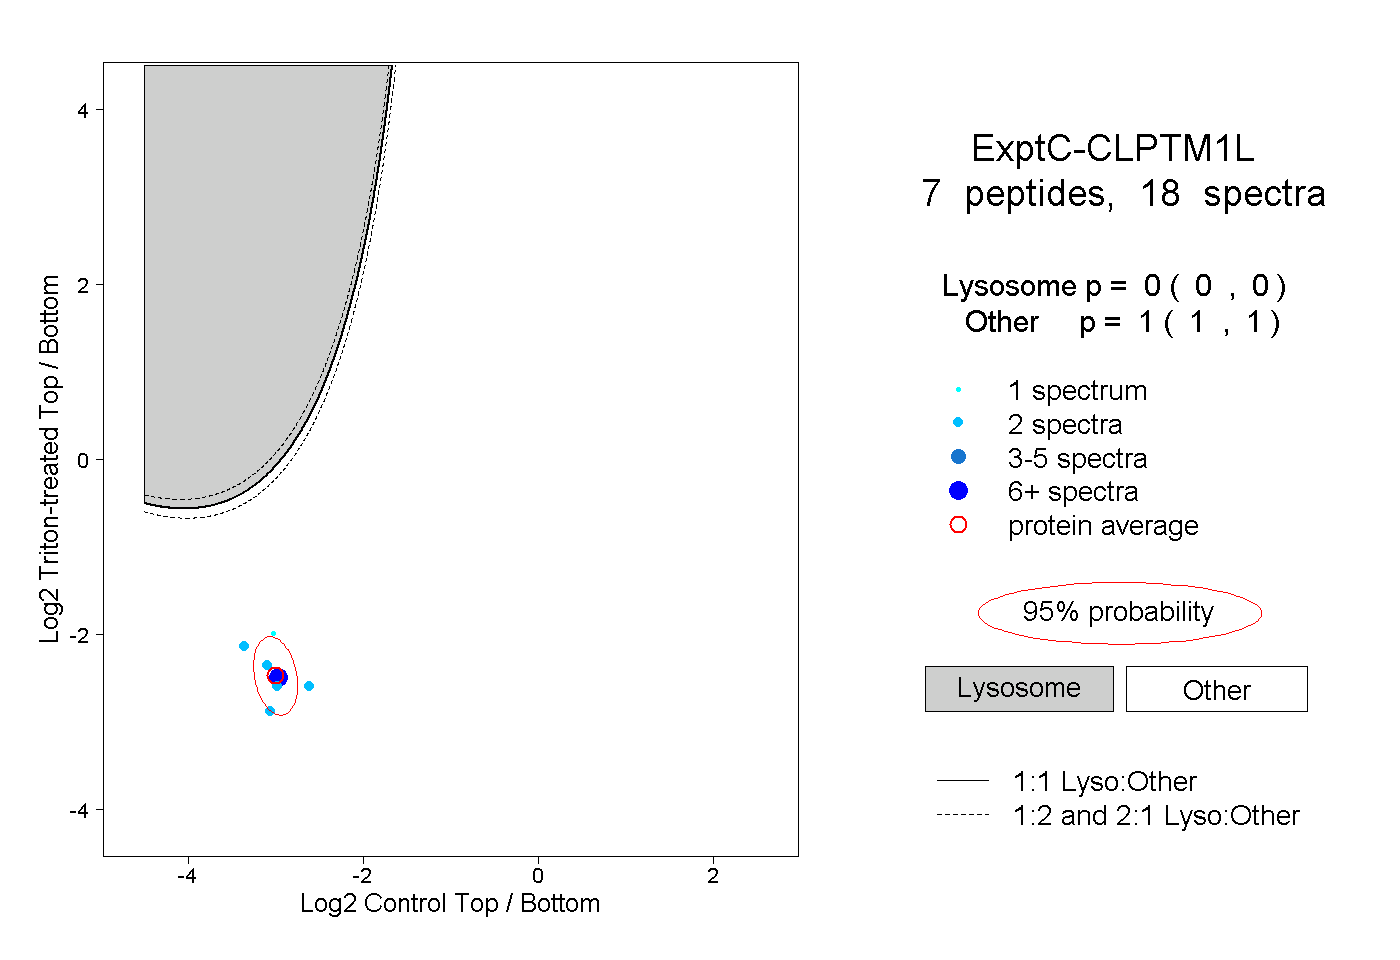
0.000 | 0.000
1.000 | 1.000