 6
6peptides
spectra
0.000 | 0.095
0.000 | 0.000
0.000 | 0.082
0.124 | 0.285
0.132 | 0.291
0.000 | 0.023
0.396 | 0.460
0.016 | 0.088
1peptide
spectrum
NA | NA
NA | NA
NA | NA
NA | NA
NA | NA
NA | NA
NA | NA
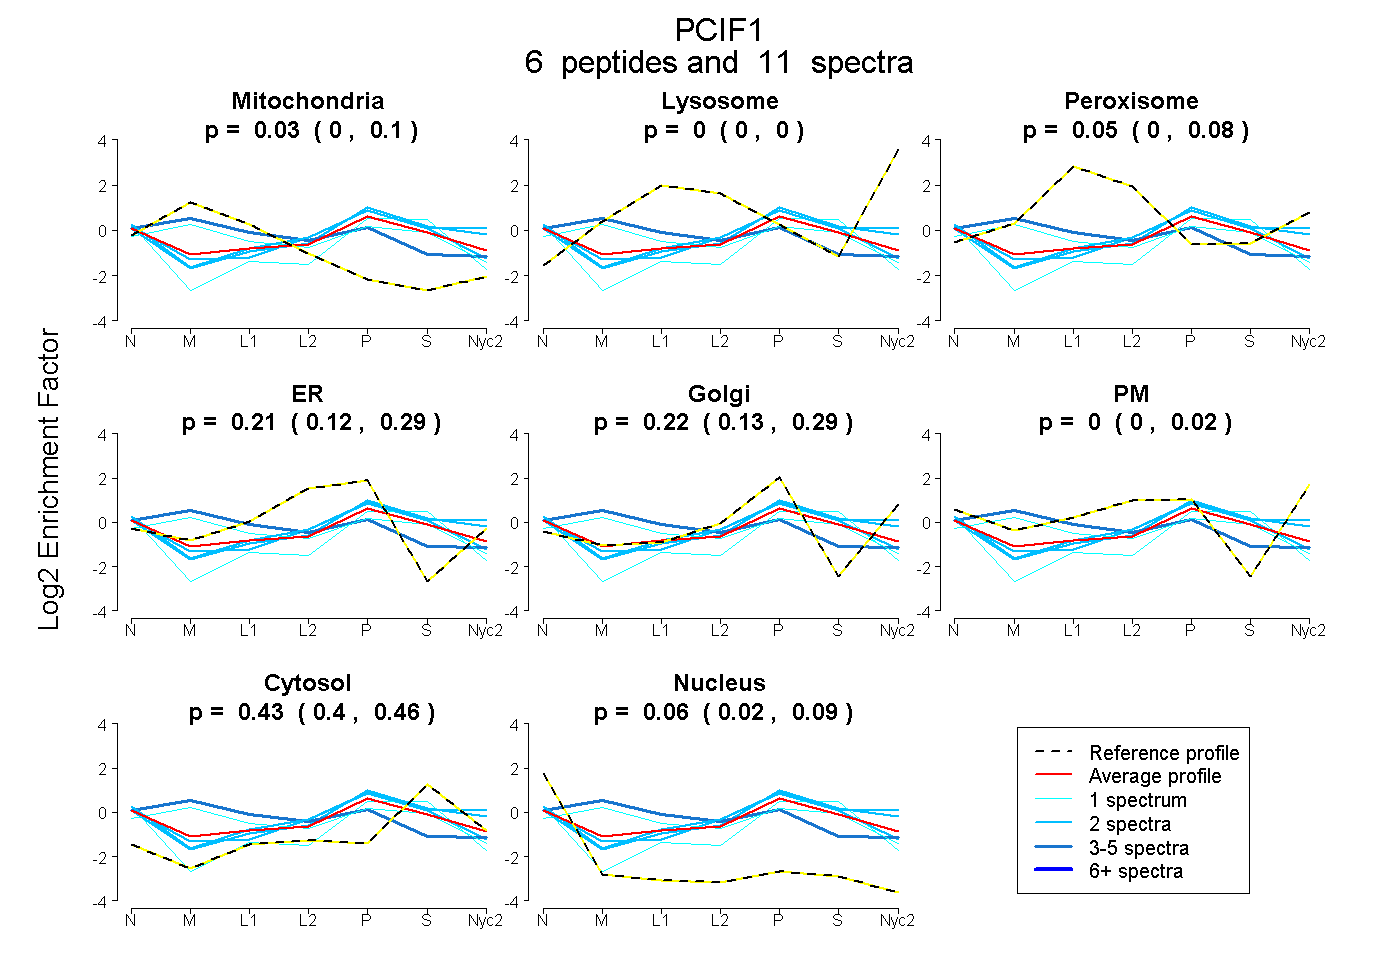
| Plot | Mito | Lyso | Perox | ER | Golgi | PM | Cytosol | Nucleus | |||||
| Expt A |
6 peptides |
11 spectra |
|
0.030 0.000 | 0.095 |
0.000 0.000 | 0.000 |
0.050 0.000 | 0.082 |
0.208 0.124 | 0.285 |
0.221 0.132 | 0.291 |
0.000 0.000 | 0.023 |
0.427 0.396 | 0.460 |
0.064 0.016 | 0.088 |
||
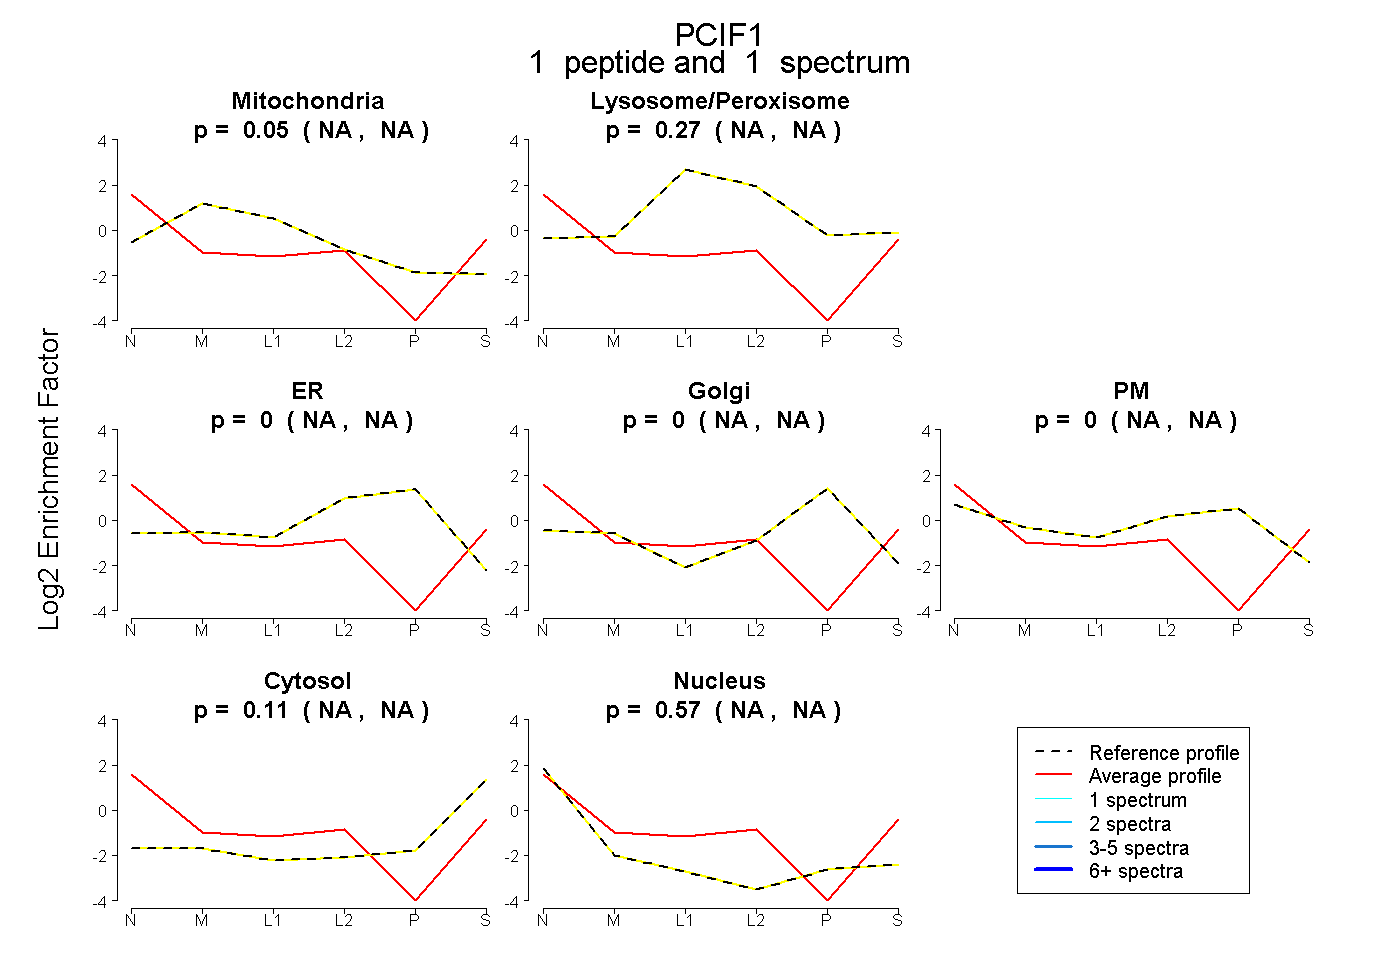
| Plot | Mito | Lyso or Perox | ER | Golgi | PM | Cytosol | Nucleus | ||||||
| Expt B |
1 peptide |
1 spectrum |
|
0.046 NA | NA |
0.266 NA | NA |
0.000 NA | NA |
0.000 NA | NA |
0.000 NA | NA |
0.114 NA | NA |
0.574 NA | NA |