 3
3peptides
spectra
0.160 | 0.259
0.000 | 0.000
0.000 | 0.000
0.000 | 0.000
0.462 | 0.530
0.000 | 0.000
0.000 | 0.000
0.234 | 0.331
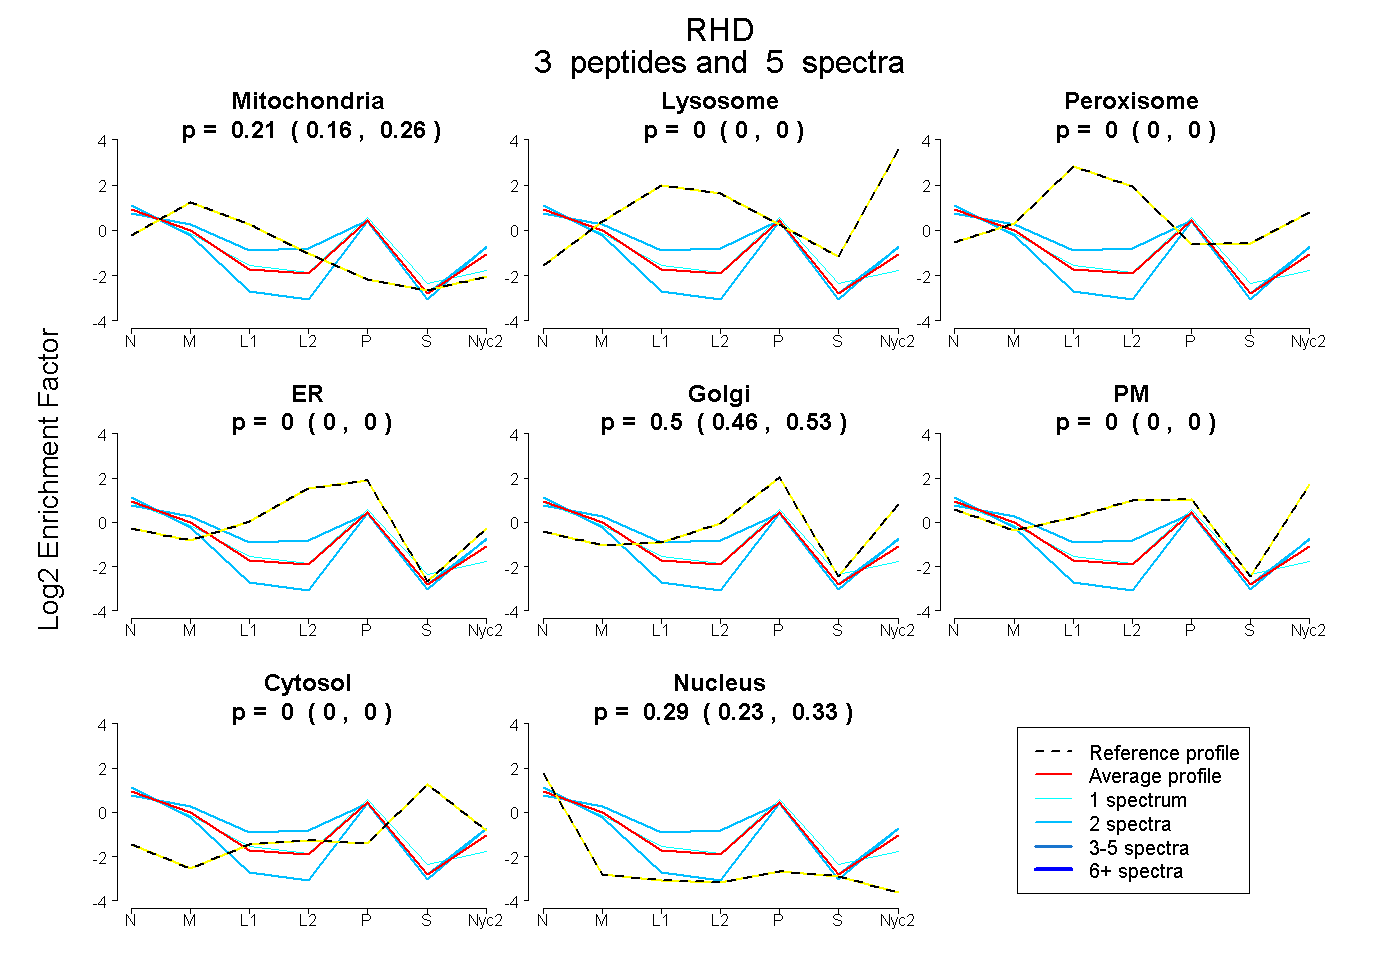
| Plot | Mito | Lyso | Perox | ER | Golgi | PM | Cytosol | Nucleus | |||||
| Expt A |
3 peptides |
5 spectra |
|
0.213 0.160 | 0.259 |
0.000 0.000 | 0.000 |
0.000 0.000 | 0.000 |
0.000 0.000 | 0.000 |
0.500 0.462 | 0.530 |
0.000 0.000 | 0.000 |
0.000 0.000 | 0.000 |
0.287 0.234 | 0.331 |
| 1 spectrum, APHAVK | 0.234 | 0.000 | 0.000 | 0.000 | 0.458 | 0.000 | 0.000 | 0.308 | ||
| 2 spectra, NPFSPFLSIQR | 0.031 | 0.000 | 0.000 | 0.000 | 0.517 | 0.000 | 0.000 | 0.452 | ||
| 2 spectra, HENAQTEK | 0.331 | 0.000 | 0.000 | 0.000 | 0.400 | 0.142 | 0.000 | 0.127 |