 9
9peptides
spectra
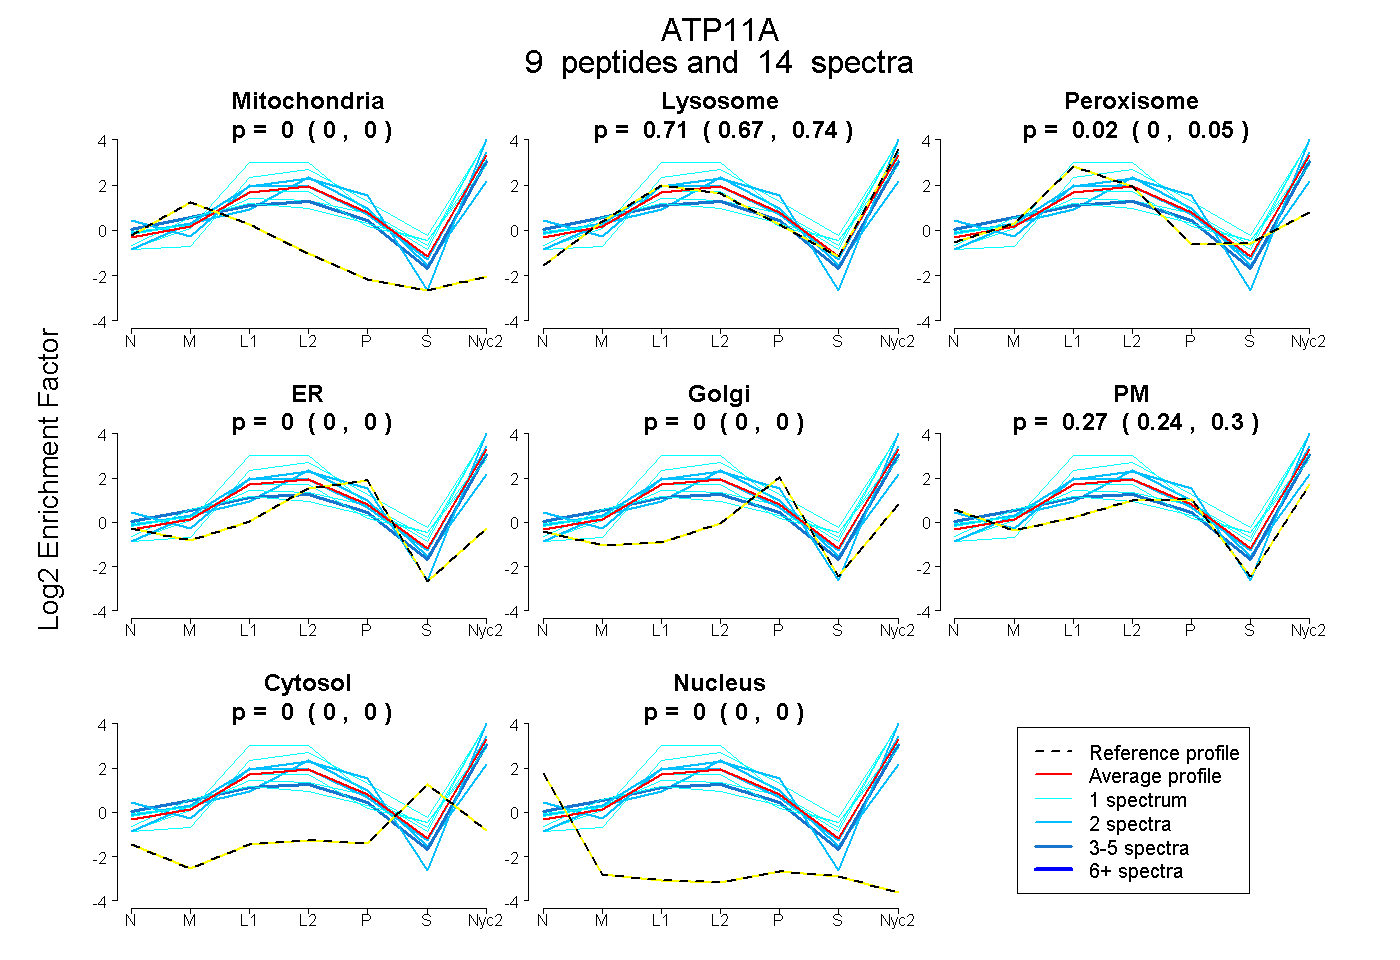
0.000 | 0.000
0.673 | 0.744
0.000 | 0.049
0.000 | 0.000
0.000 | 0.000
0.239 | 0.298
0.000 | 0.000
0.000 | 0.000
1peptide
spectra
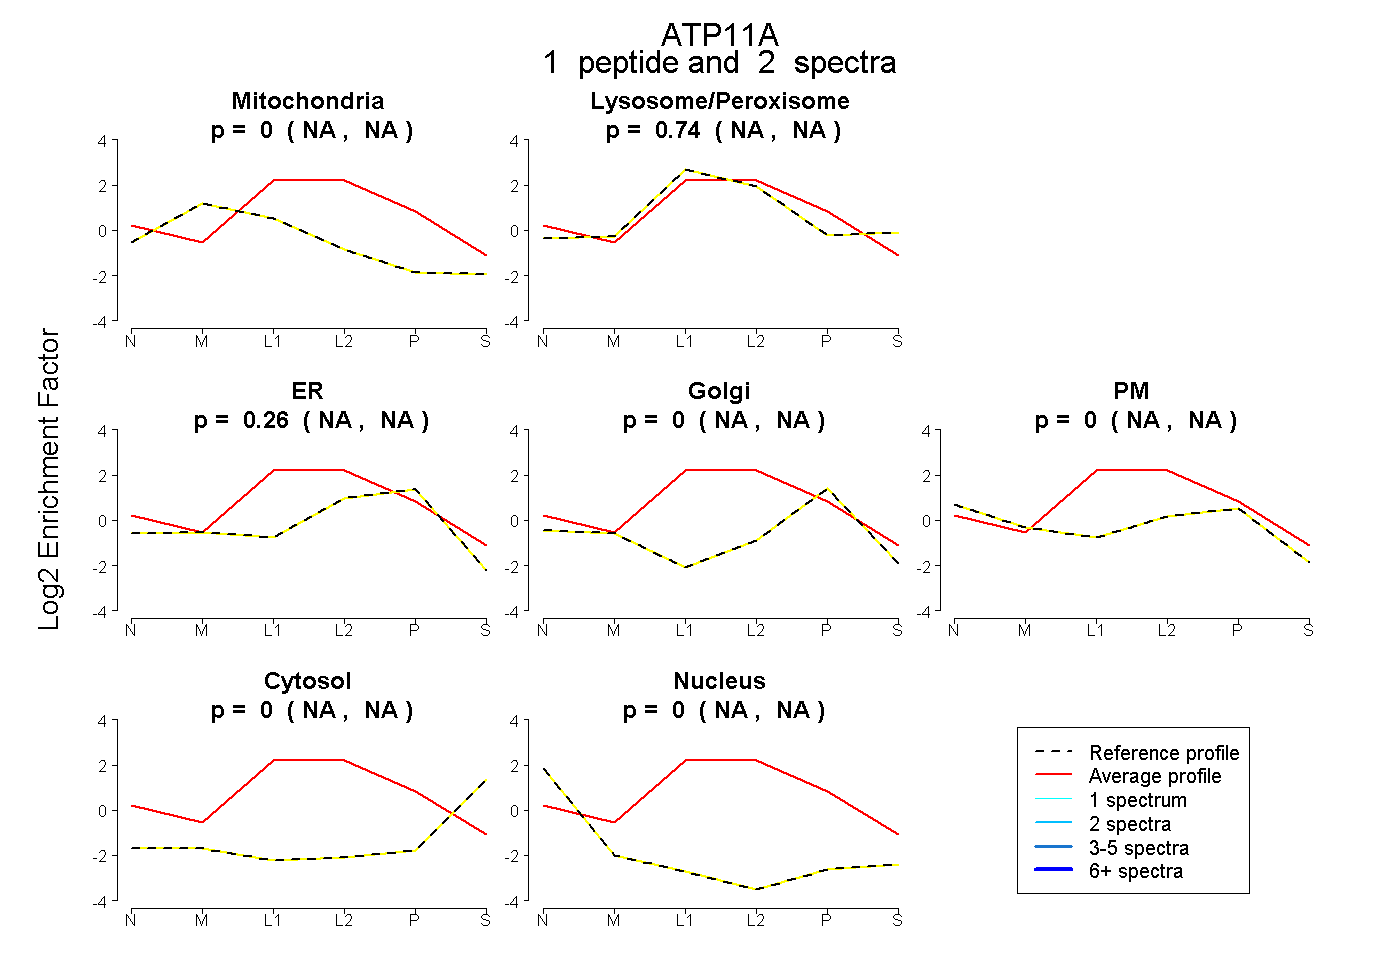
NA | NA
NA | NA
NA | NA
NA | NA
NA | NA
NA | NA
NA | NA
19peptides
spectra
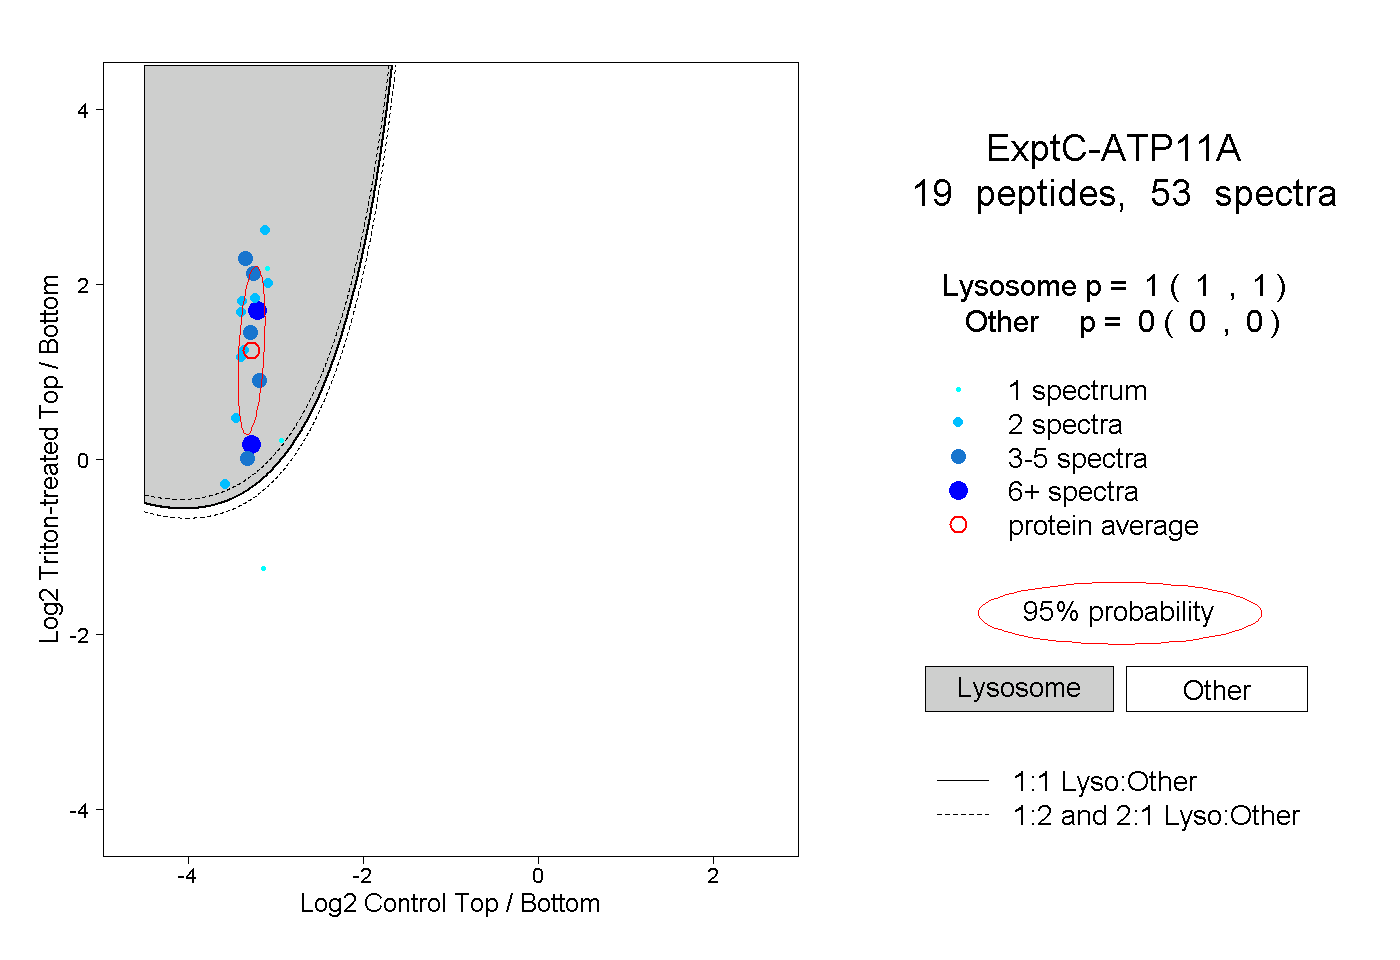
1.000 | 1.000
0.000 | 0.000
4peptides
spectra
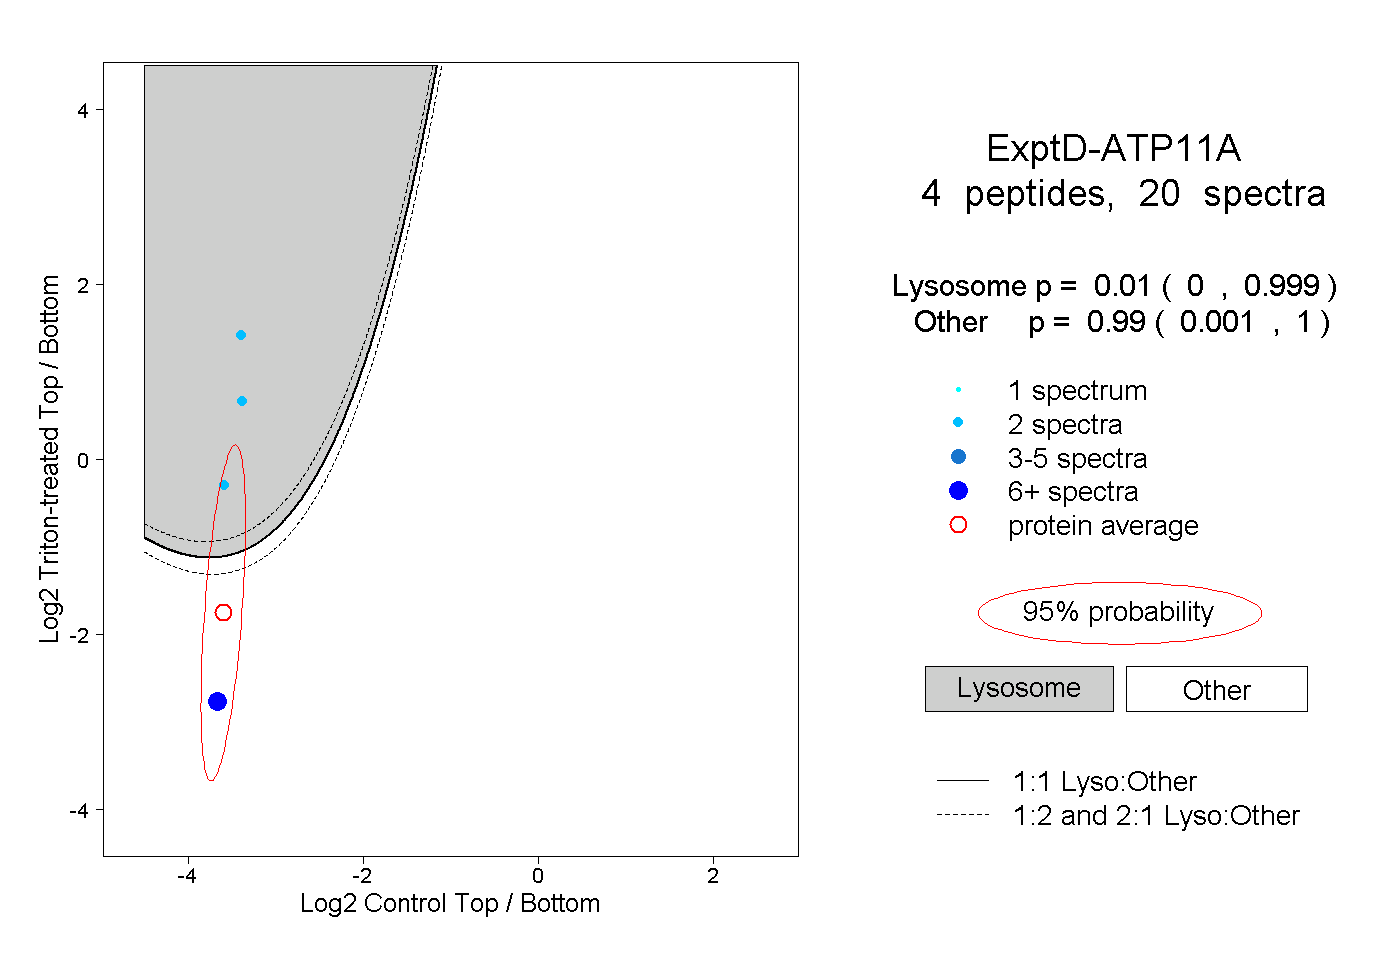
0.000 | 0.999
0.001 | 1.000