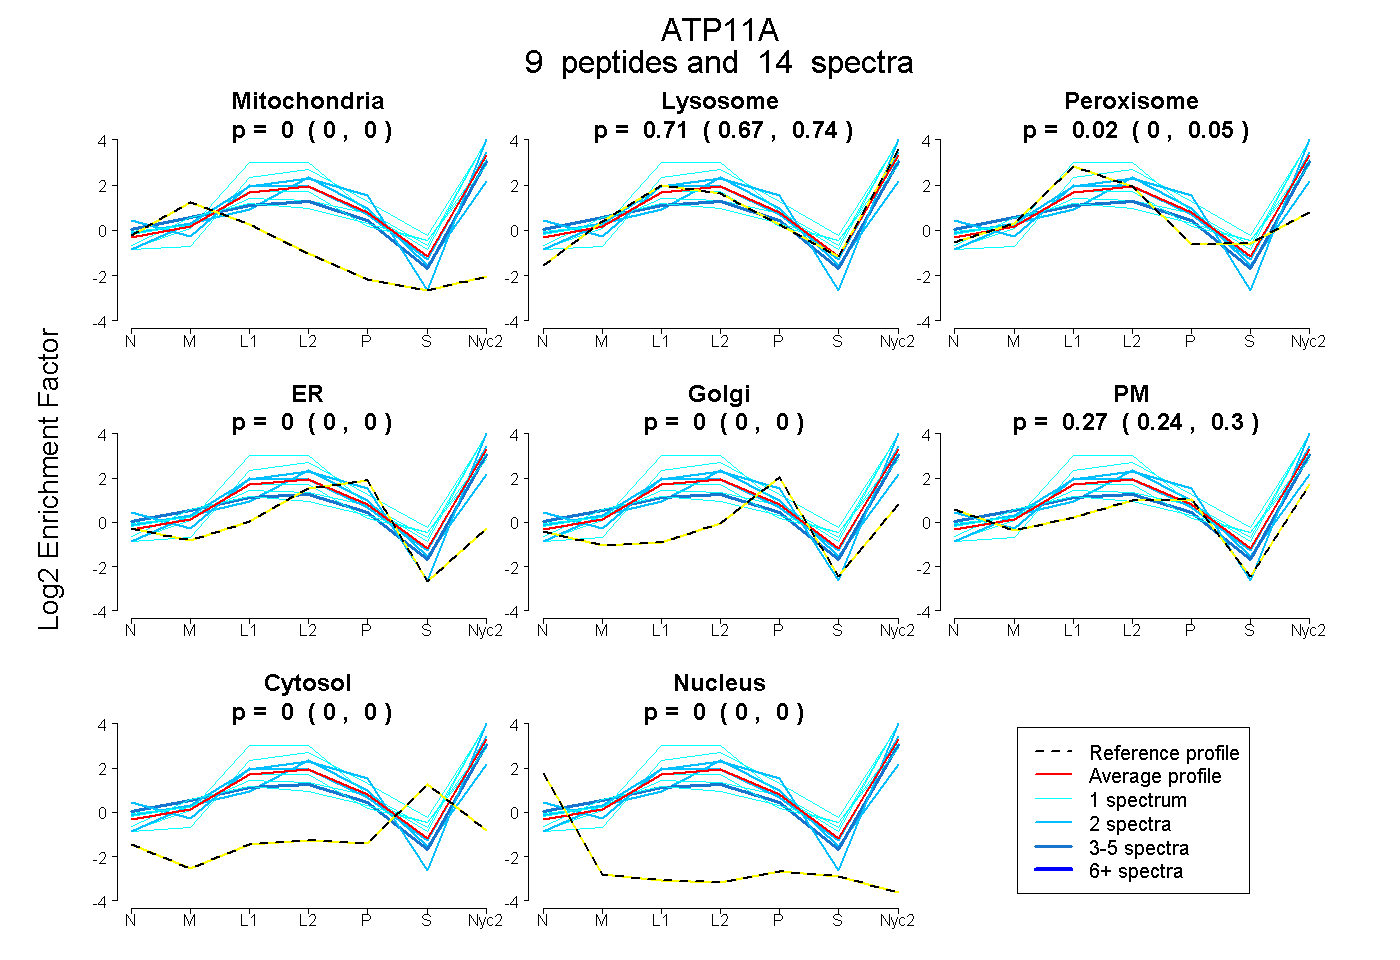
 9
9peptides
spectra
0.000 | 0.000
0.673 | 0.744
0.000 | 0.049
0.000 | 0.000
0.000 | 0.000
0.239 | 0.298
0.000 | 0.000
0.000 | 0.000
| Plot | Mito | Lyso | Perox | ER | Golgi | PM | Cytosol | Nucleus | |||||
| Expt A |
9 peptides |
14 spectra |
|
0.000 0.000 | 0.000 |
0.714 0.673 | 0.744 |
0.016 0.000 | 0.049 |
0.000 0.000 | 0.000 |
0.000 0.000 | 0.000 |
0.270 0.239 | 0.298 |
0.000 0.000 | 0.000 |
0.000 0.000 | 0.000 |
| 2 spectra, LEPEQYEDACR | 0.000 | 0.599 | 0.053 | 0.000 | 0.000 | 0.348 | 0.000 | 0.000 | ||
| 1 spectrum, DLILLGATAVEDR | 0.000 | 0.944 | 0.056 | 0.000 | 0.000 | 0.000 | 0.000 | 0.000 | ||
| 1 spectrum, DDHCGDDVDGPQK | 0.000 | 0.993 | 0.000 | 0.007 | 0.000 | 0.000 | 0.000 | 0.000 | ||
| 1 spectrum, MSVIVK | 0.000 | 0.754 | 0.000 | 0.000 | 0.000 | 0.146 | 0.100 | 0.000 | ||
| 1 spectrum, DPSLYR | 0.000 | 0.770 | 0.000 | 0.000 | 0.000 | 0.230 | 0.000 | 0.000 | ||
| 2 spectra, LGFTYLR | 0.000 | 0.775 | 0.000 | 0.000 | 0.000 | 0.225 | 0.000 | 0.000 | ||
| 2 spectra, AICLCHTVQVK | 0.000 | 0.406 | 0.096 | 0.167 | 0.000 | 0.330 | 0.000 | 0.000 | ||
| 1 spectrum, TLCVAYK | 0.000 | 0.537 | 0.260 | 0.000 | 0.000 | 0.193 | 0.010 | 0.000 | ||
| 3 spectra, EPPPGAEAYIPQR | 0.000 | 0.527 | 0.000 | 0.000 | 0.000 | 0.473 | 0.000 | 0.000 |
| Plot | Mito | Lyso or Perox | ER | Golgi | PM | Cytosol | Nucleus | ||||||
| Expt B |
1 peptide |
2 spectra |
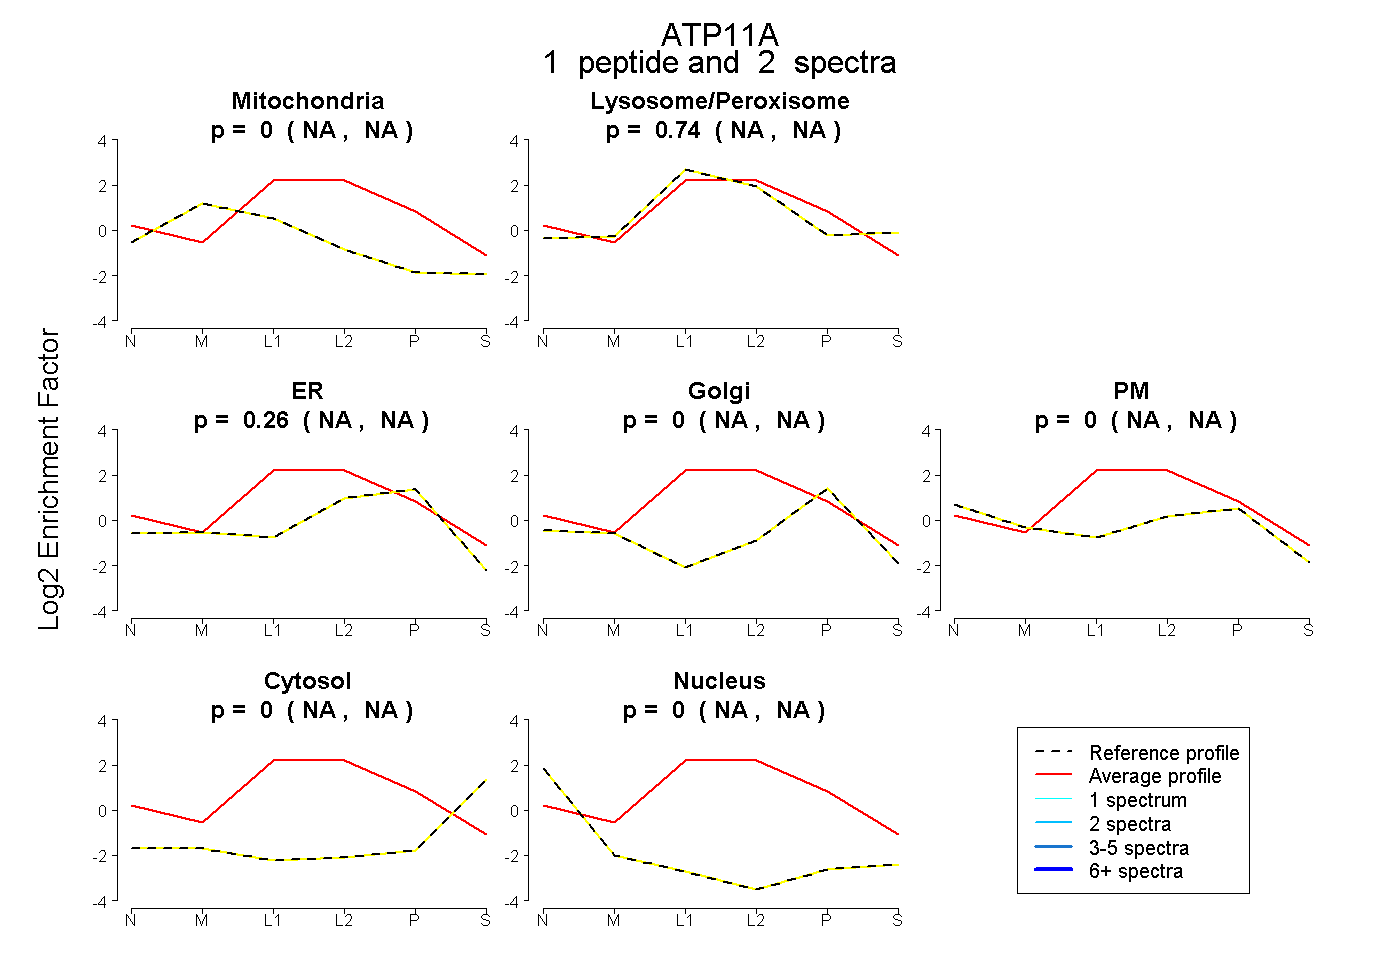 |
0.000 NA | NA |
0.742 NA | NA |
0.258 NA | NA |
0.000 NA | NA |
0.000 NA | NA |
0.000 NA | NA |
0.000 NA | NA |
|||
| Plot | Lyso | Other | |||||||||||
| Expt C |
19 peptides |
53 spectra |
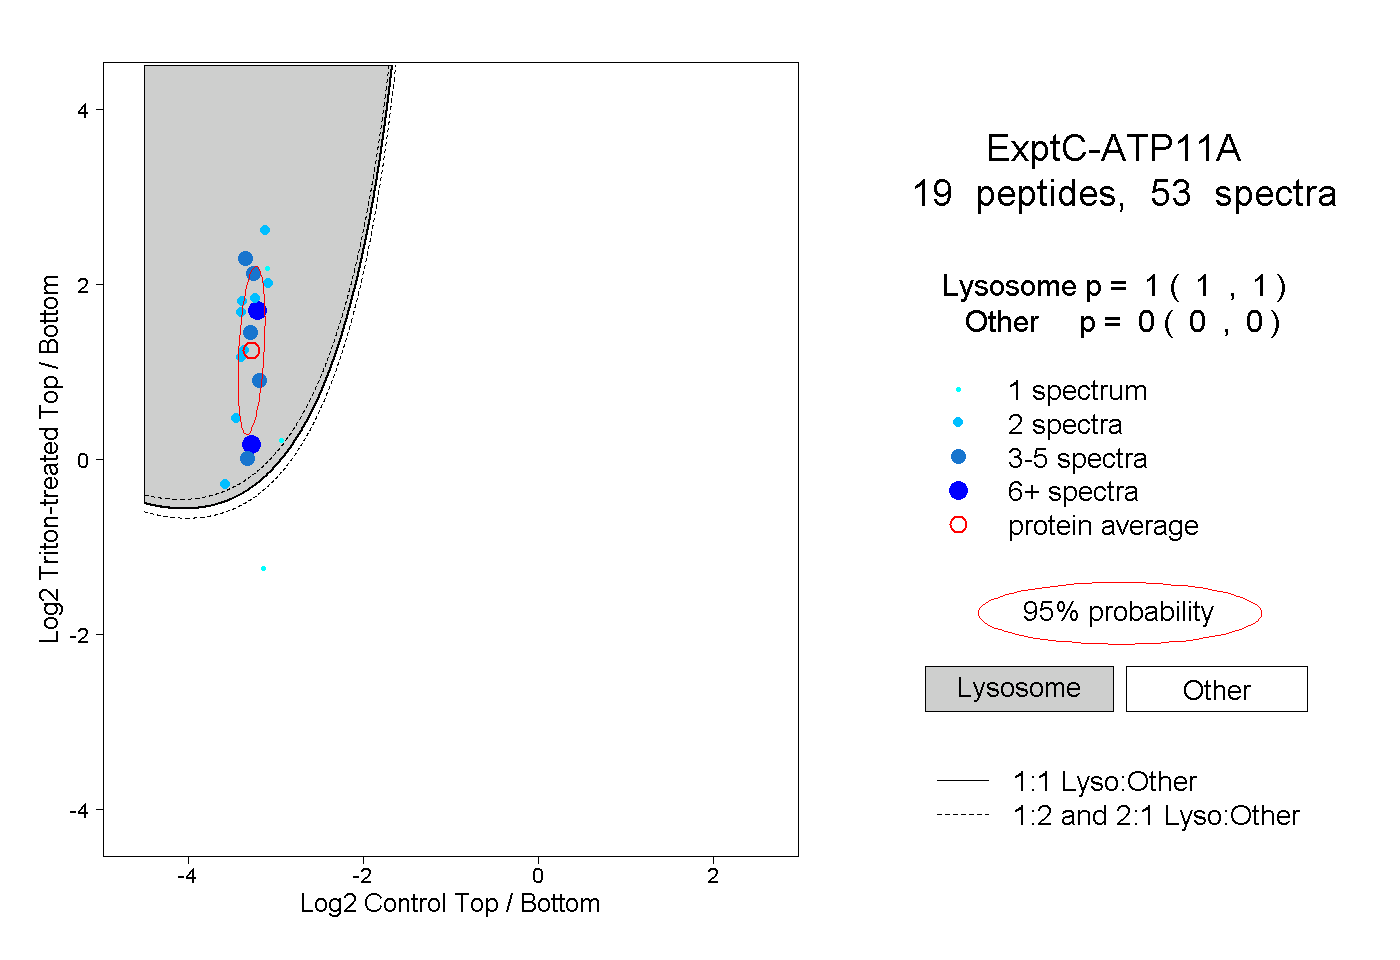 |
1.000 1.000 | 1.000 |
0.000 0.000 | 0.000 |
||||||||
| Plot | Lyso | Other | |||||||||||
| Expt D |
4 peptides |
20 spectra |
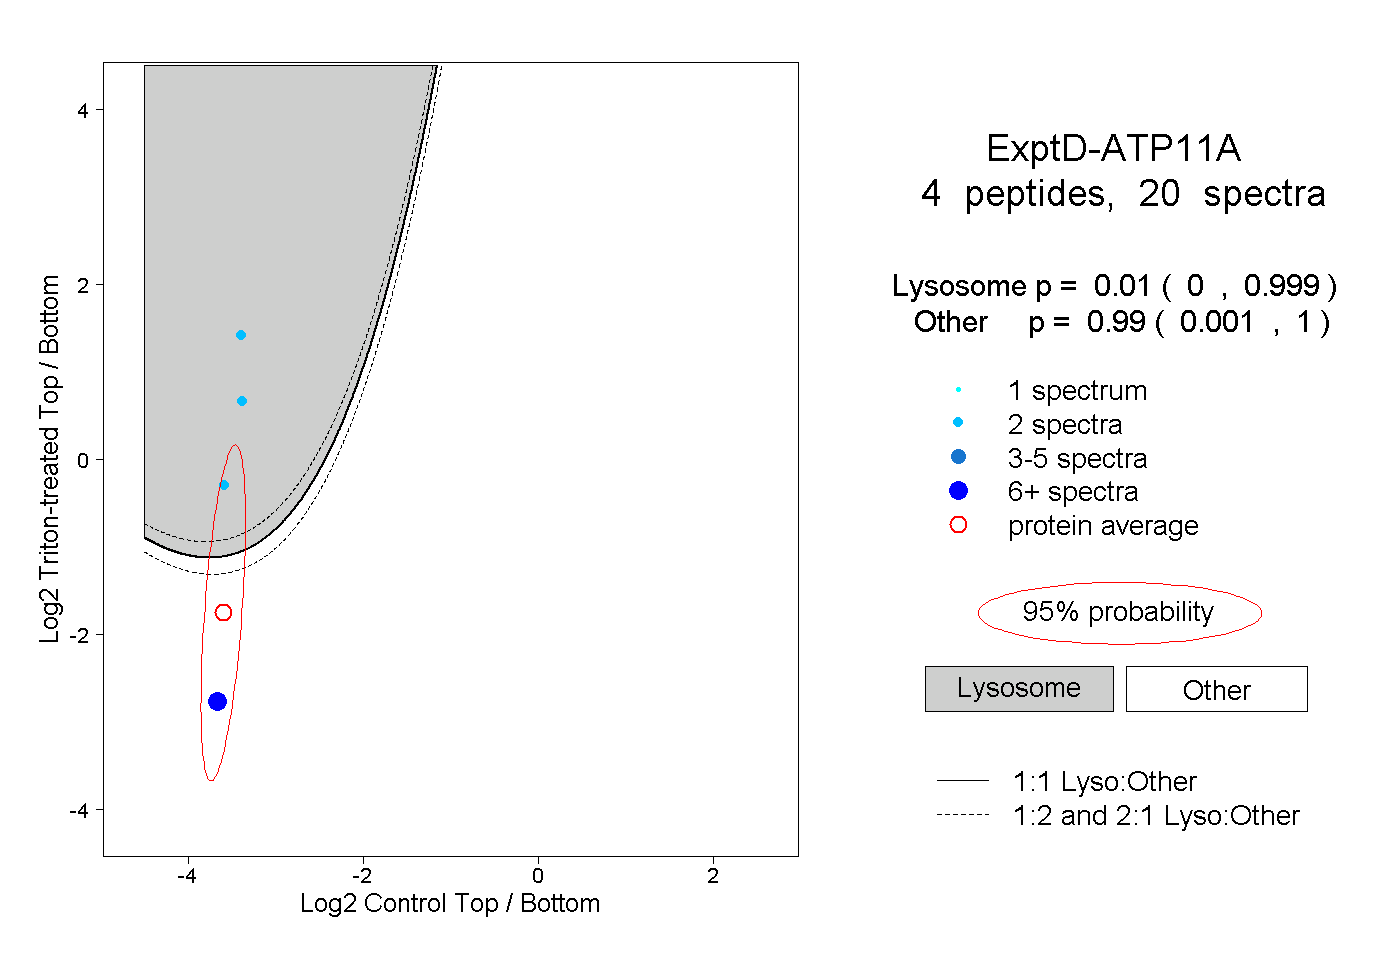 |
0.010 0.000 | 0.999 |
0.990 0.001 | 1.000 |