 21
21peptides
spectra
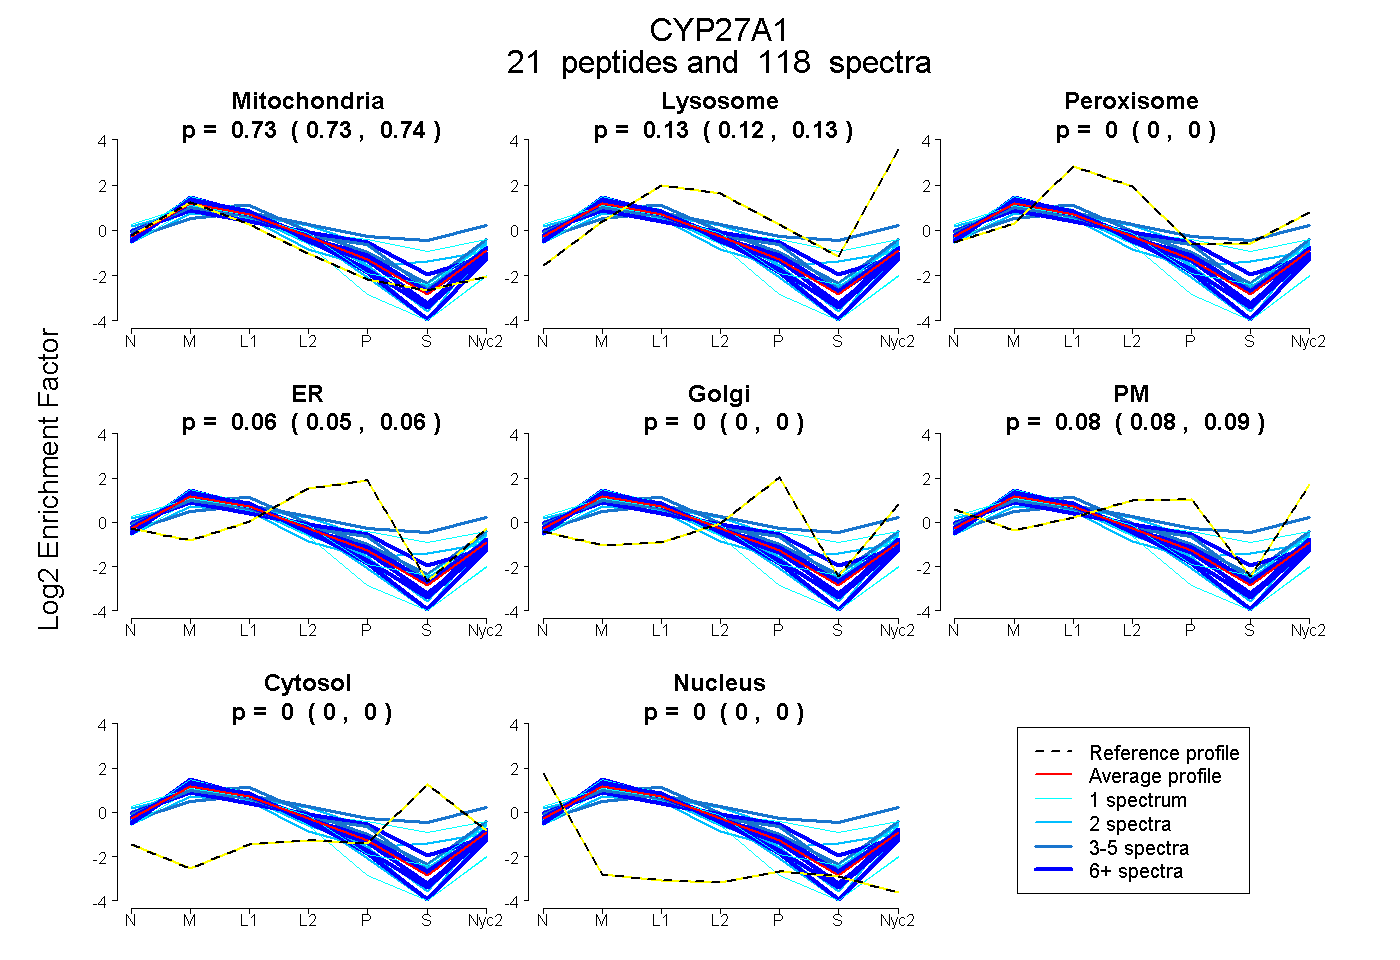
0.729 | 0.735
0.124 | 0.132
0.000 | 0.000
0.049 | 0.061
0.000 | 0.000
0.076 | 0.090
0.000 | 0.000
0.000 | 0.000
16peptides
spectra
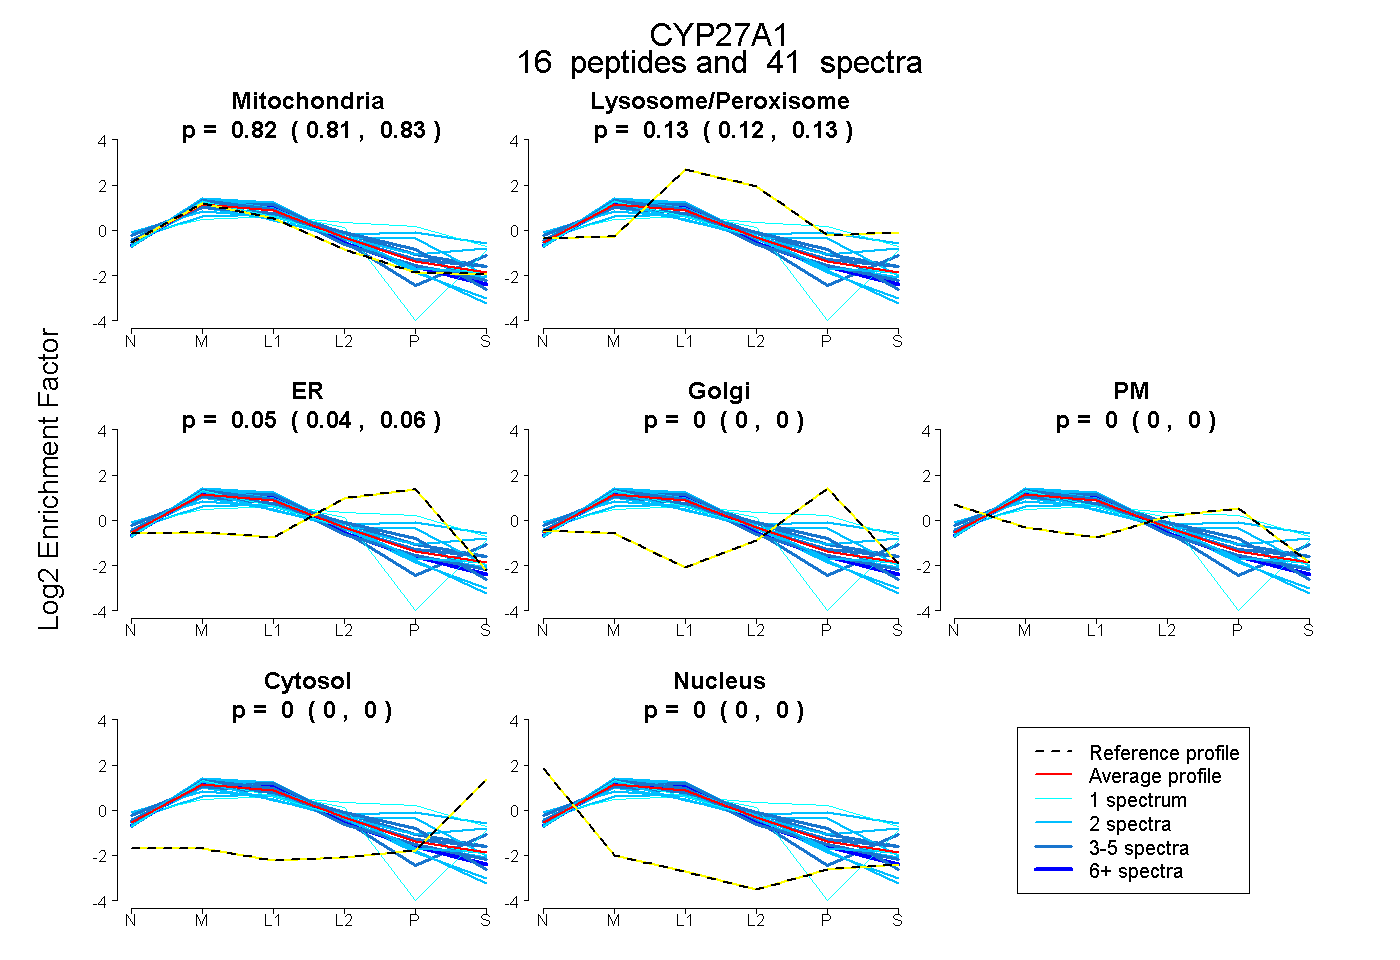
0.812 | 0.832
0.119 | 0.134
0.039 | 0.060
0.000 | 0.000
0.000 | 0.000
0.000 | 0.000
0.000 | 0.000
24peptides
spectra
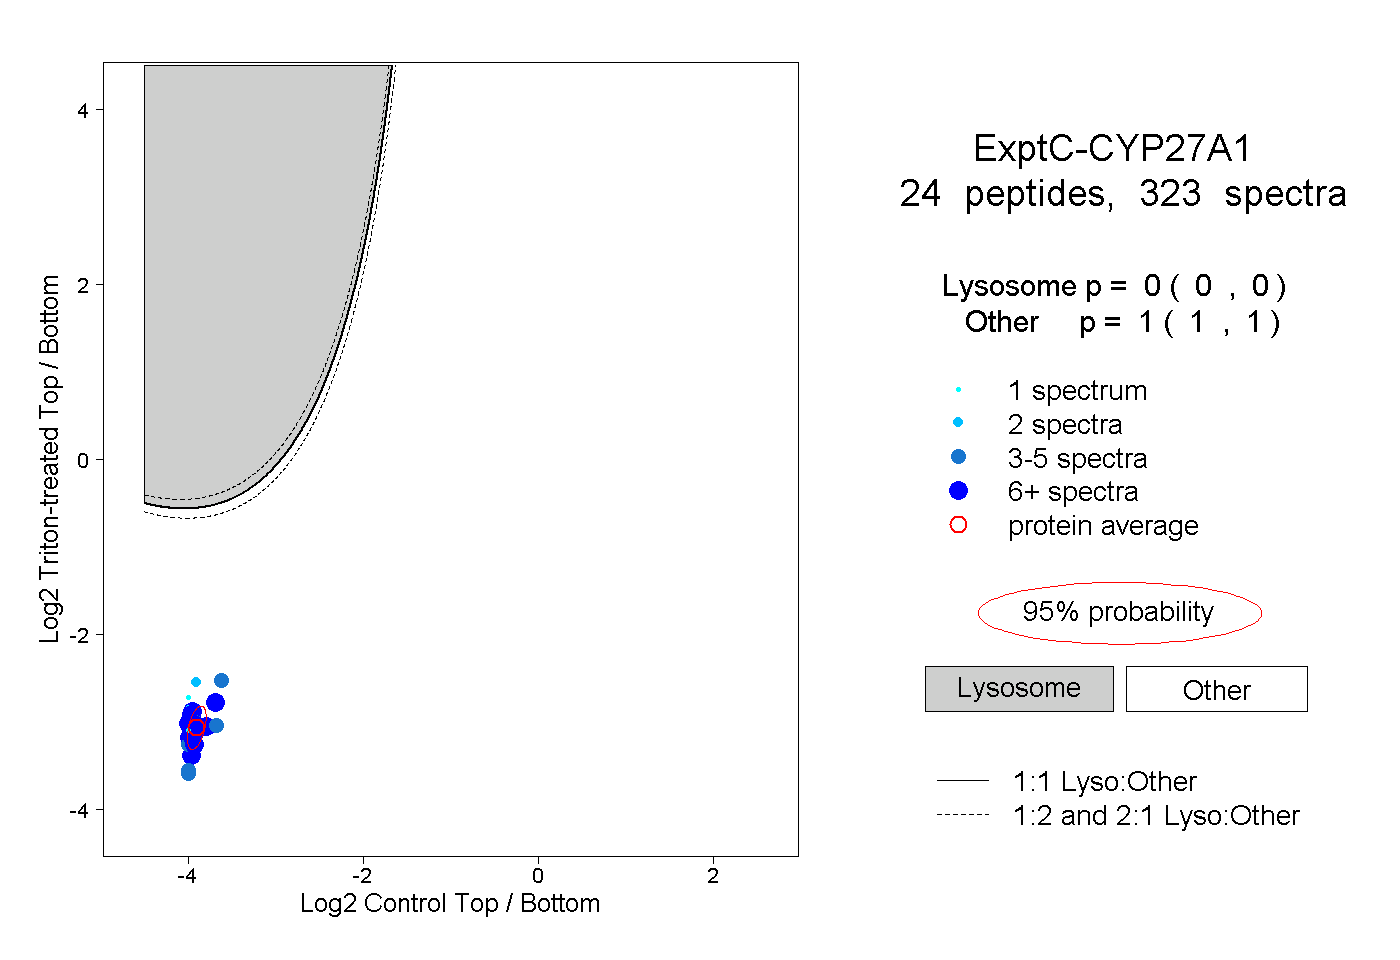
0.000 | 0.000
1.000 | 1.000
7peptides
spectra
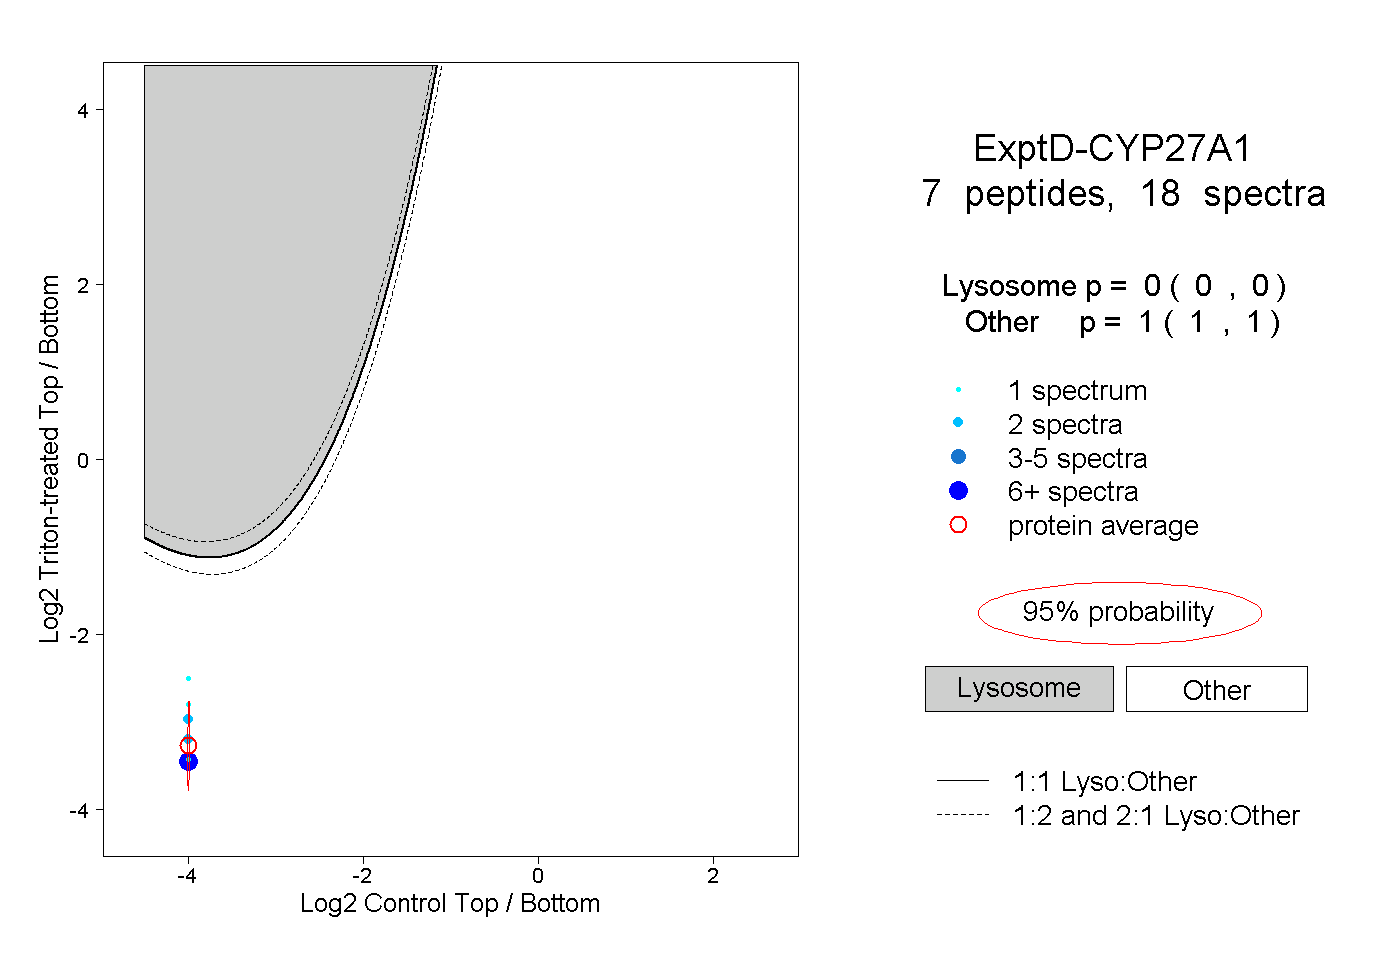
0.000 | 0.000
1.000 | 1.000