 10
10peptides
spectra
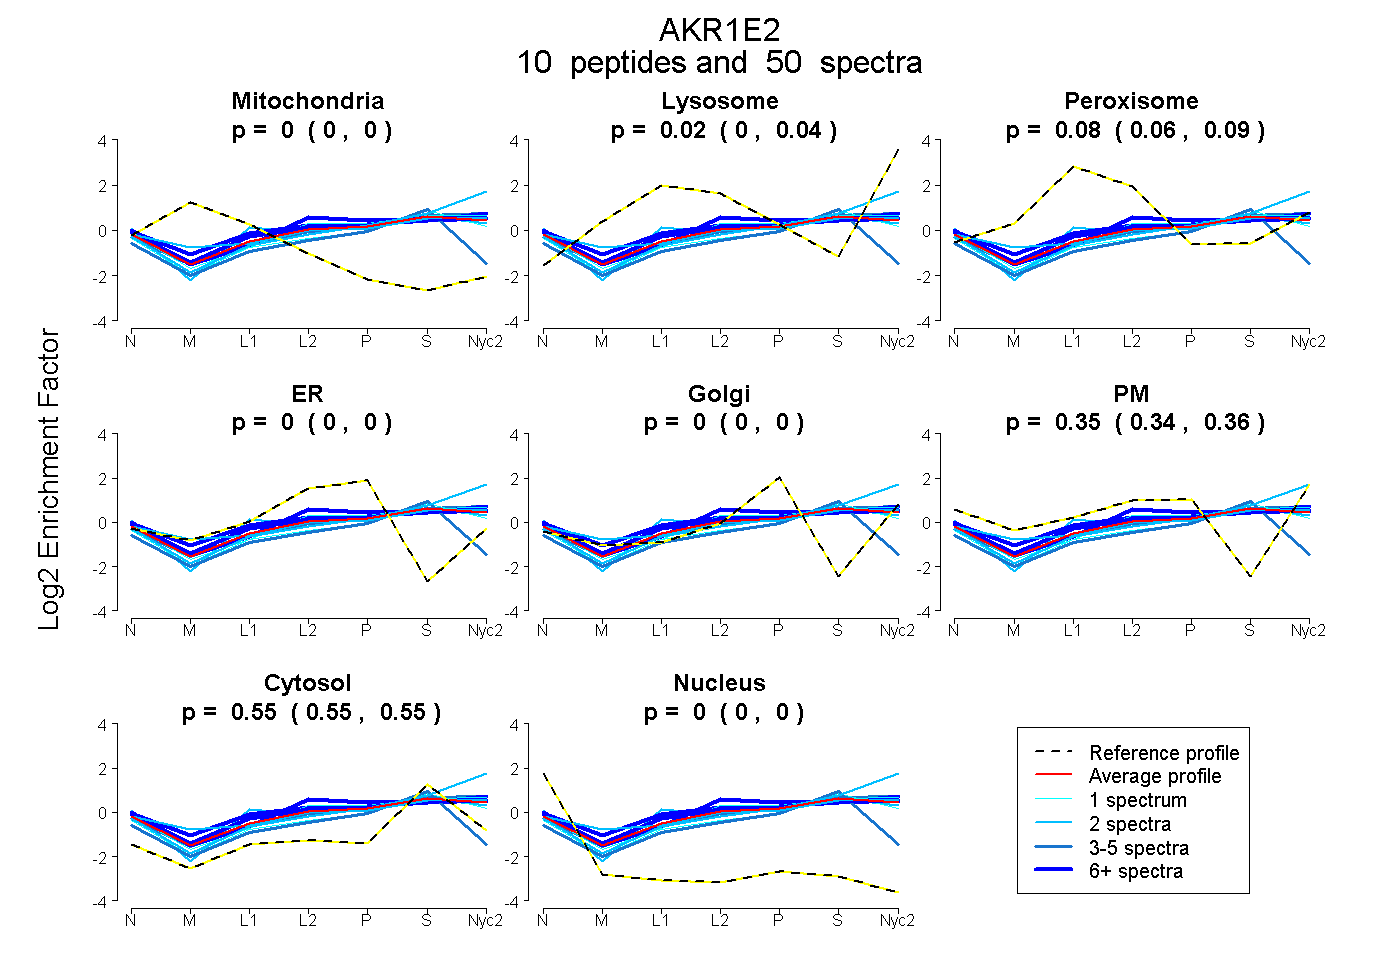
0.000 | 0.000
0.002 | 0.039
0.060 | 0.093
0.000 | 0.000
0.000 | 0.000
0.344 | 0.356
0.545 | 0.553
0.000 | 0.000
5peptides
spectra
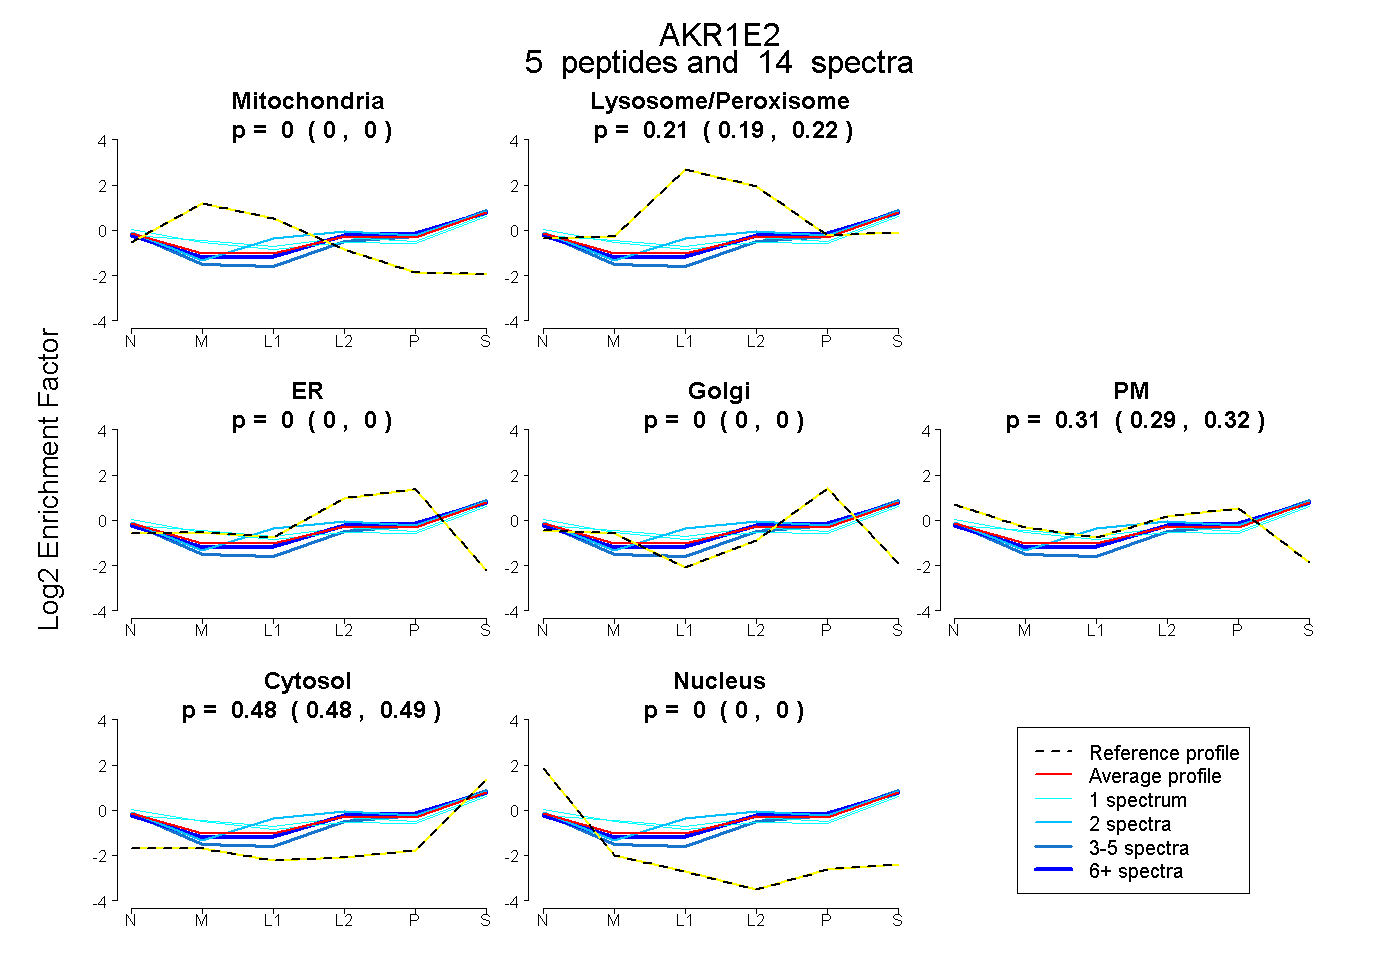
0.000 | 0.000
0.186 | 0.223
0.000 | 0.000
0.000 | 0.000
0.294 | 0.323
0.476 | 0.492
0.000 | 0.000
13peptides
spectra
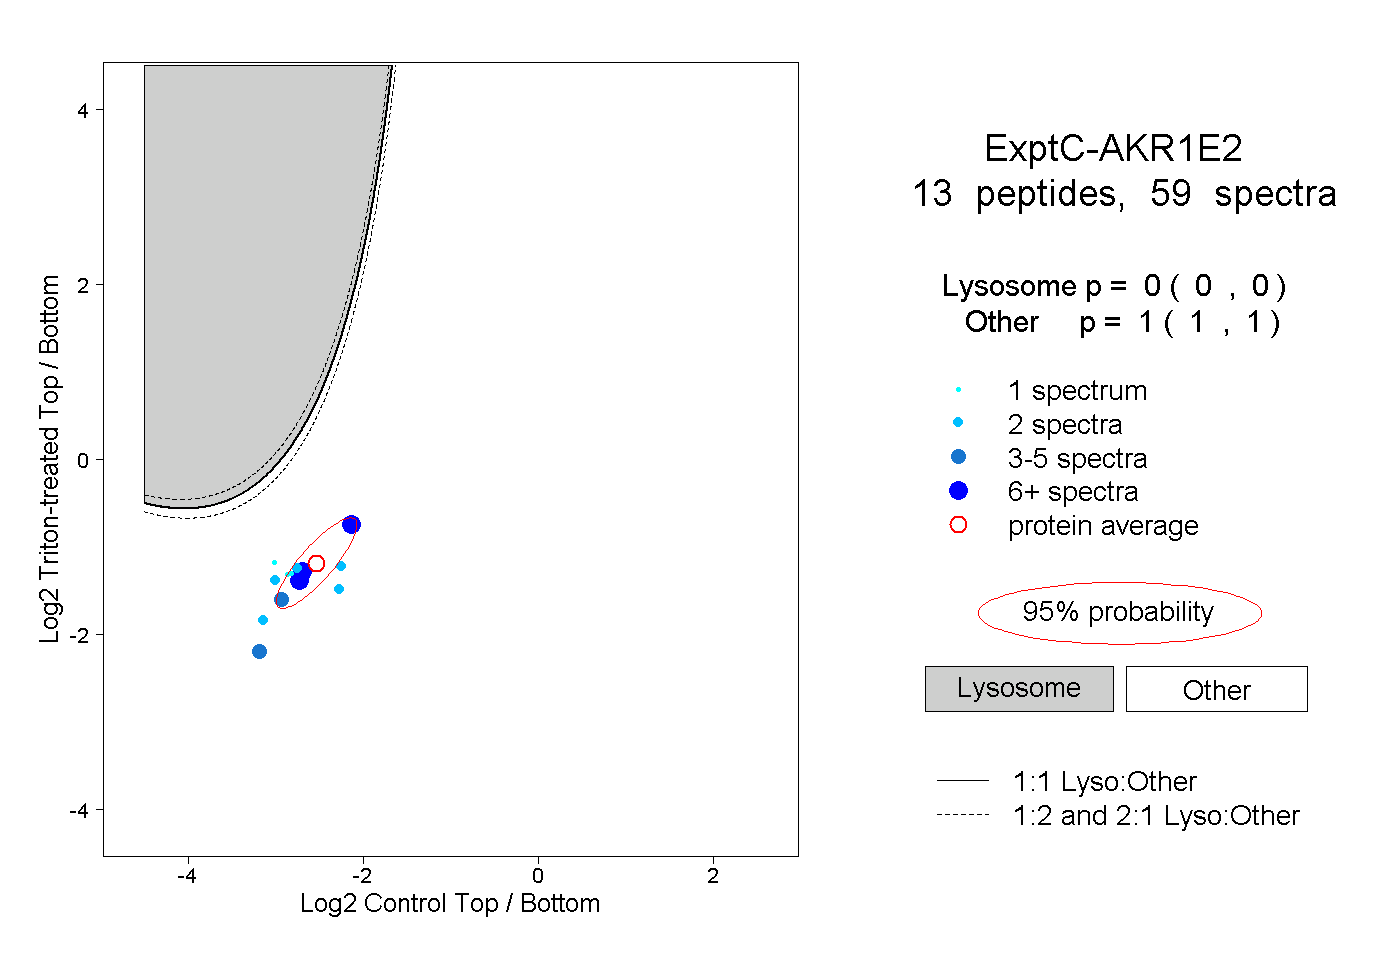
0.000 | 0.000
1.000 | 1.000
4peptides
spectra
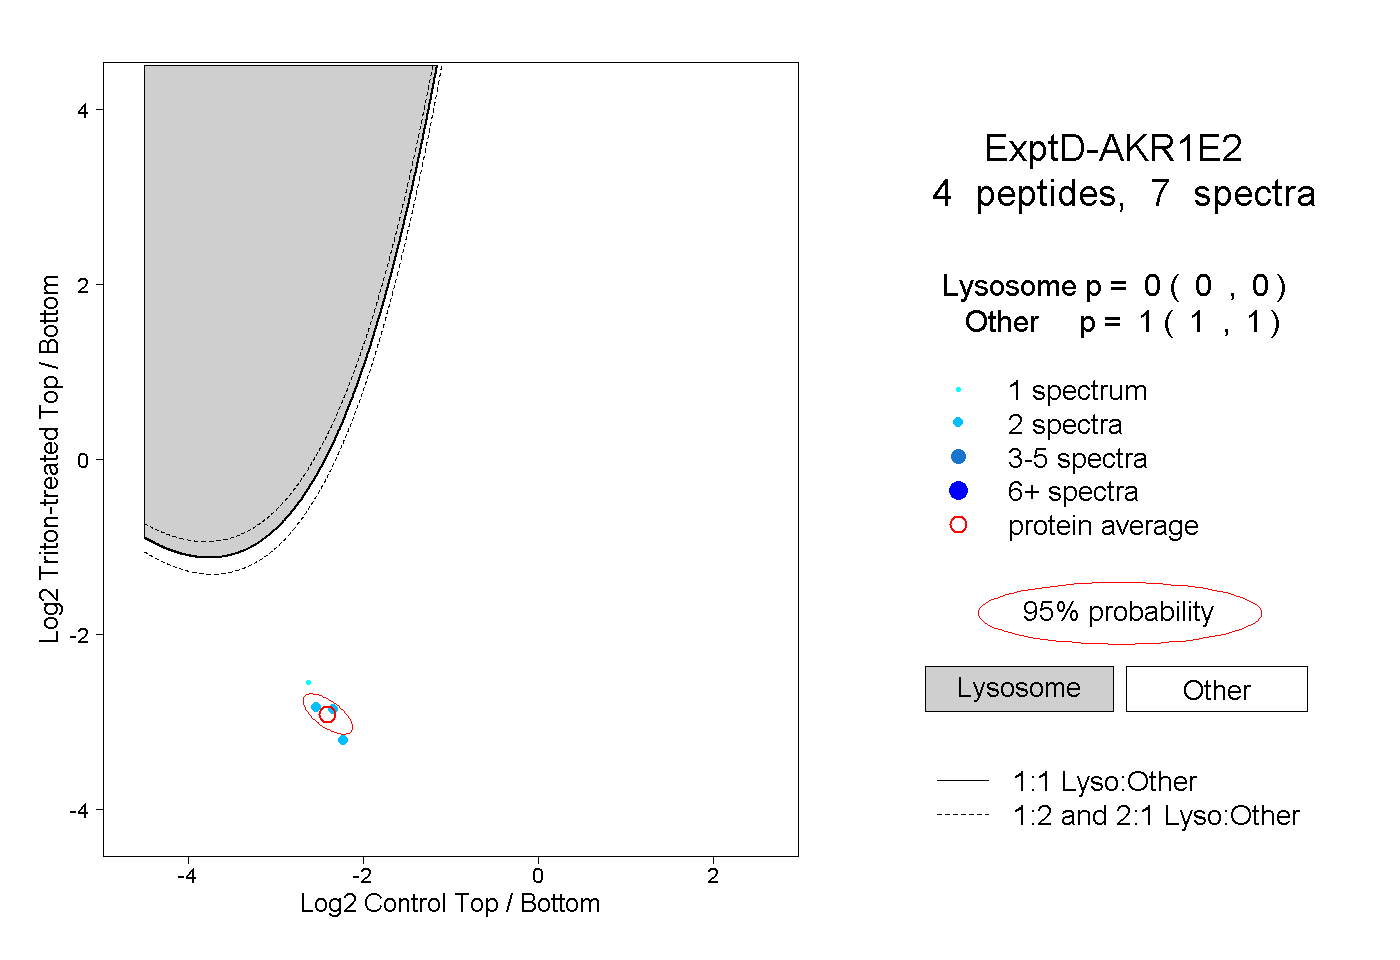
0.000 | 0.000
1.000 | 1.000